Workshop overview · Reference
Tour the stack
Six UIs, six URLs, and what to click in each one.
The workshop runs ~21 containers. You only ever look at six of them: Sonda server, Prometheus, Alertmanager, Grafana, Prefect, and Infrahub. This page is the single reference for how to reach each one, what to expect when you do, and where it shows up in the four parts.
How to read this page
This page is meant to be skimmed, not deep-dived (unless you want to, of course).
Think of it as a guided overview of the workshop stack — the six UIs you'll meet, what each component is responsible for, and how to interact with the key buttons and panels of each one. Enough to recognise the tool when you meet it in a guide.
You don't need to memorise anything here. The four part guides (Part 1, Part 2, Part 3, Advanced) link back to specific sections of this page whenever a tool comes up that you'd benefit from knowing more about. Glance through once now so the names feel familiar, and come back later when a guide points you somewhere specific.
Sonda server — the synthetic telemetry control plane
What this is
Sonda is a synthetic telemetry generator. Instead of running real network devices (which need disk, RAM, licenses, and patience), Sonda runs a small HTTP server that pretends to be one — it emits fake-but-realistic Prometheus metrics and syslog lines on the same shapes your collectors expect, so the rest of your observability stack (Telegraf, Prometheus, Loki, Grafana, alert rules) can be wired up and exercised against a known-shaped workload. Think of it as a controllable traffic generator, but for telemetry instead of packets.
In this workshop, the Sonda server at http://localhost:8085 is the box that pretends to be srl1 and srl2. Every metric Prometheus stores and every log line Loki indexes during the workshop ultimately came out of a Sonda scenario. There's no UI — it's an HTTP API, and you'll mostly poke it with curl (or with nobs autocon5 scenarios). The unit of work is a scenario: a small recipe that says "emit this metric, with these labels, on this cadence, with this shape".
A single workshop boot registers 76 scenarios — sonda-server fans each kind: composable pack out into one scenario per metric (38 per device, 2 devices). One scenario emits one metric series; the ID is a server-assigned UUID and the name is the metric name (srl_bgp_oper_state, bgpPeerState, cpu_used, …).
Endpoints worth knowing
| Endpoint | What it returns |
|---|---|
GET /health |
Liveness probe. Returns {"status":"ok"}. |
GET /scenarios |
Every scenario currently registered on the server, with id (UUID), name (metric name), state, elapsed_secs, degraded. |
GET /scenarios/{uuid} |
One scenario's live handle: identity (id, name), state, elapsed_secs, plus an embedded stats block. |
GET /scenarios/{uuid}/stats |
Per-scenario emission counters: total_events, current_rate, target_rate, bytes_emitted, errors, consecutive_failures, gap/burst state, and last_successful_write_at. |
GET /scenarios/{uuid}/metrics |
The single Prometheus-text sample this scenario is emitting right now. Drained on read. |
GET /scenarios/metrics[?label=k:v] |
Aggregate Prometheus-text snapshot across every running scenario. Optional label=key:value filter narrows to one device. Snapshot semantics — multiple consumers (Telegraf and a curl) can read the same bytes concurrently. |
POST /scenarios |
Register a new scenario. The cascade flap (nobs autocon5 flap-interface) is one of these. |
DELETE /scenarios/{uuid} |
Stop and unregister a scenario. |
Try it
The friendly version — nobs autocon5 scenarios renders the same data as a Rich table:
                                Sonda scenarios
┏━━━━━━━━━━━━━━━━━━━━━━━━━━━━━━━━━━━━━━┳━━━━━━━━━━━━━━┳━━━━━━━━━━━━┳━━━━━━━━━━━━━━┓
┃ ID                                   ┃ Name         ┃     Status ┃      Elapsed ┃
┡━━━━━━━━━━━━━━━━━━━━━━━━━━━━━━━━━━━━━━╇━━━━━━━━━━━━━━╇━━━━━━━━━━━━╇━━━━━━━━━━━━━━┩
│ e3c9b721-52ca-4d3b-ae78-56521e05600d │ ifOperStat…  │    running │ 317.78118…   │
│ a588c688-fbd3-490a-aa11-0357c3f5b75d │ ping_resul…  │    running │ 317.78112…   │
│ 4fa9f0b6-0452-48bb-817a-84f6ba3b188c │ cpu_used     │    running │ 317.80367…   │
│ 0f1fac93-b0cb-406b-b5a1-80bb74619be0 │ srl_bgp_ad…  │    running │ 317.80353…   │
│ d047315f-c34d-47f4-851c-b22bc63eefd2 │ ifOperStat…  │ unresolved │ 317.78128…   │
│ 17363c1a-795d-4b86-837b-c8df891a3023 │ srl_interf…  │ unresolved │ 317.80277…   │
│ cb568101-c33e-43ca-bf60-72a01b2808a6 │ bgpPeerInP…  │ unresolved │ 317.78173…   │
│ 374c81cb-6c95-45cb-b03c-b24953fed282 │ srl_bgp_ne…  │ unresolved │ 317.80389…   │
│ …                                    │ …            │ …          │ …            │
└──────────────────────────────────────┴──────────────┴────────────┴──────────────┘
You'll see two states in the Status column — running and unresolved. Both are healthy at rest:
running— the scenario is actively emitting samples right now (this is the obvious one).unresolved— the scenario is in standby, waiting for another scenario to be posted before it switches mode. Most of these are the workshop's baseline scenarios for the cascade-affected interfaces and BGP peers — they're still emitting their normal up-and-healthy values — they're just labeledunresolvedinstead ofrunningbecause they're waiting on aflap-interfacecascade to one day trigger. When you eventually runnobs autocon5 flap-interfacein a later part, sonda posts a matching scenario that takes over for the duration of the flap; when it ends, these baselines automatically resume.
The short version: if every row says running or unresolved, the lab is healthy. A paused, held, or finished row will only show up during or right after a flap — that's covered in Part 1. The held state is what an interface byte counter looks like during an outage: it doesn't tick (no traffic is flowing through a downed link), but it doesn't disappear either — you keep seeing the same value that was there right before the link went down, the same way a real device would behave.
The raw version — same data, just curl:
{
  "id": "43ce9ec6-69e6-4399-b391-658aef80ab9e",
  "name": "srl_interface_out_octets",
  "state": "running",
  "elapsed_secs": 46.854853114,
  "degraded": false
}
To see the actual Prometheus-text samples Telegraf reads — the byte-for-byte input, before any rename or normalization — curl the aggregate /scenarios/metrics endpoint and filter to one device with label=key:value. The endpoint is snapshot-style: Telegraf scrapes it every 10 seconds and you can read it concurrently without stealing samples from anyone.
curl -s 'http://localhost:8085/scenarios/metrics?label=source:srl1' | grep '^srl_bgp_oper_state{' | grep '10.1.99.2' | head -1
srl_bgp_oper_state{afi_safi_name="ipv4-unicast",collection_type="gnmi",name="default",neighbor_asn="65102",peer_address="10.1.99.2",source="srl1"} 5
Note the metric name (srl_bgp_oper_state) and the source="srl1" tag — that's the gNMI shape SR Linux puts on the wire. Compare it to what Prometheus stores after Telegraf renames it (bgp_oper_state{device="srl1",...}) and you've seen the entire normalization pipeline end-to-end. Part 1's exercise 6 walks both sides.
srl2 uses the SNMP shape, where the device tag is agent_host:
curl -s 'http://localhost:8085/scenarios/metrics?label=agent_host:srl2' | grep '^bgpPeerState{' | grep '10.1.2.1' | head -1
bgpPeerState{afi_safi_name="ipv4-unicast",agent_host="srl2",bgpPeerRemoteAddr="10.1.2.1",bgpPeerRemoteAs="65101",collection_type="snmp",name="default"} 1
Inspect the catalog from inside the container
The catalog of packs and scenarios Sonda resolves pack: refs against is mounted at /catalog inside the sonda-server container. The sonda CLI is also baked in — the container ships both sonda-server and the /sonda binary, so you can run any CLI command against the same catalog the server is using:
docker compose --project-name autocon5 exec sonda-server \
  /sonda --catalog /catalog list --kind composable
KIND        NAME                        TAGS  DESCRIPTION
composable  cisco_snmp_bgp_raw                Cisco-style SNMP BGP per-peer metrics (raw, pre-normalization, BGP4-MIB / CISCO-BGP4-MIB)
composable  cisco_snmp_interface_raw          Cisco-style SNMP per-interface metrics (raw, pre-normalization, IF-MIB)
composable  srlinux_gnmi_bgp                  SR Linux gNMI BGP per-peer metrics (Telegraf-normalized)
composable  srlinux_gnmi_bgp_raw              SR Linux gNMI BGP per-peer metrics (raw, pre-normalization)
composable  srlinux_gnmi_interface            SR Linux gNMI per-interface metrics (Telegraf-normalized)
composable  srlinux_gnmi_interface_raw        SR Linux gNMI per-interface metrics (raw, pre-normalization)
composable  srlinux_ping                      Ping reachability + latency (Telegraf inputs.ping shape)
Drop --kind composable to also list runnable scenarios in the catalog, or swap list for show <name> to dump a pack's raw YAML.
Where you'll see this in the workshop
- Part 1 — When you query Prometheus and see
bgp_oper_state{device="srl1"}return three rows with one stuck at5instead of1, that's a value Sonda is generating right now.curl 'http://localhost:8085/scenarios/metrics?label=source:srl1'shows you the raw side of that same number. - Part 3 —
nobs autocon5 flap-interfaceandnobs autocon5 incidentboth POST cascade scenarios to this server. - Advanced — When you write your own scenario, you'll POST it here.
Prometheus — the metrics store
What this is
Prometheus is a time-series database for metrics, plus a query language (PromQL) for asking questions about them. It pulls samples on a schedule from anything that exposes a /metrics endpoint in its text format, stores them, and lets you graph or alert on them. It's the de-facto standard for cloud-native monitoring; if you've worked anywhere with Kubernetes you've probably brushed up against it.
In this workshop, Prometheus at http://localhost:9090 stores every metric Telegraf scrapes off the Sonda fake devices. The same Prometheus instance also evaluates the alerting rules that drive Alertmanager and the recording rules that smooth out per-interval rate calculations.
The four pages you'll actually use
| Page | URL | What it tells you |
|---|---|---|
| Query browser | http://localhost:9090/graph | Type PromQL, get a graph or a table. Your main tool in Part 1. |
| Targets | http://localhost:9090/targets | Every scrape target Prometheus knows about, with last-scrape time and up{} status. |
| Alerts | http://localhost:9090/alerts | Every alerting rule, with its current state (inactive, pending, firing). |
| Rules | http://localhost:9090/rules | Every recording and alerting rule, with last-eval time and error count. |
Targets — verifying telemetry is flowing
Open http://localhost:9090/targets. You should see at least two scrape jobs UP:
telegraf-srl1(port9005inside the workshop network) — feeds the gNMI-style raw metrics from Sonda.telegraf-srl2(port9005) — feeds the SNMP-style raw metrics.
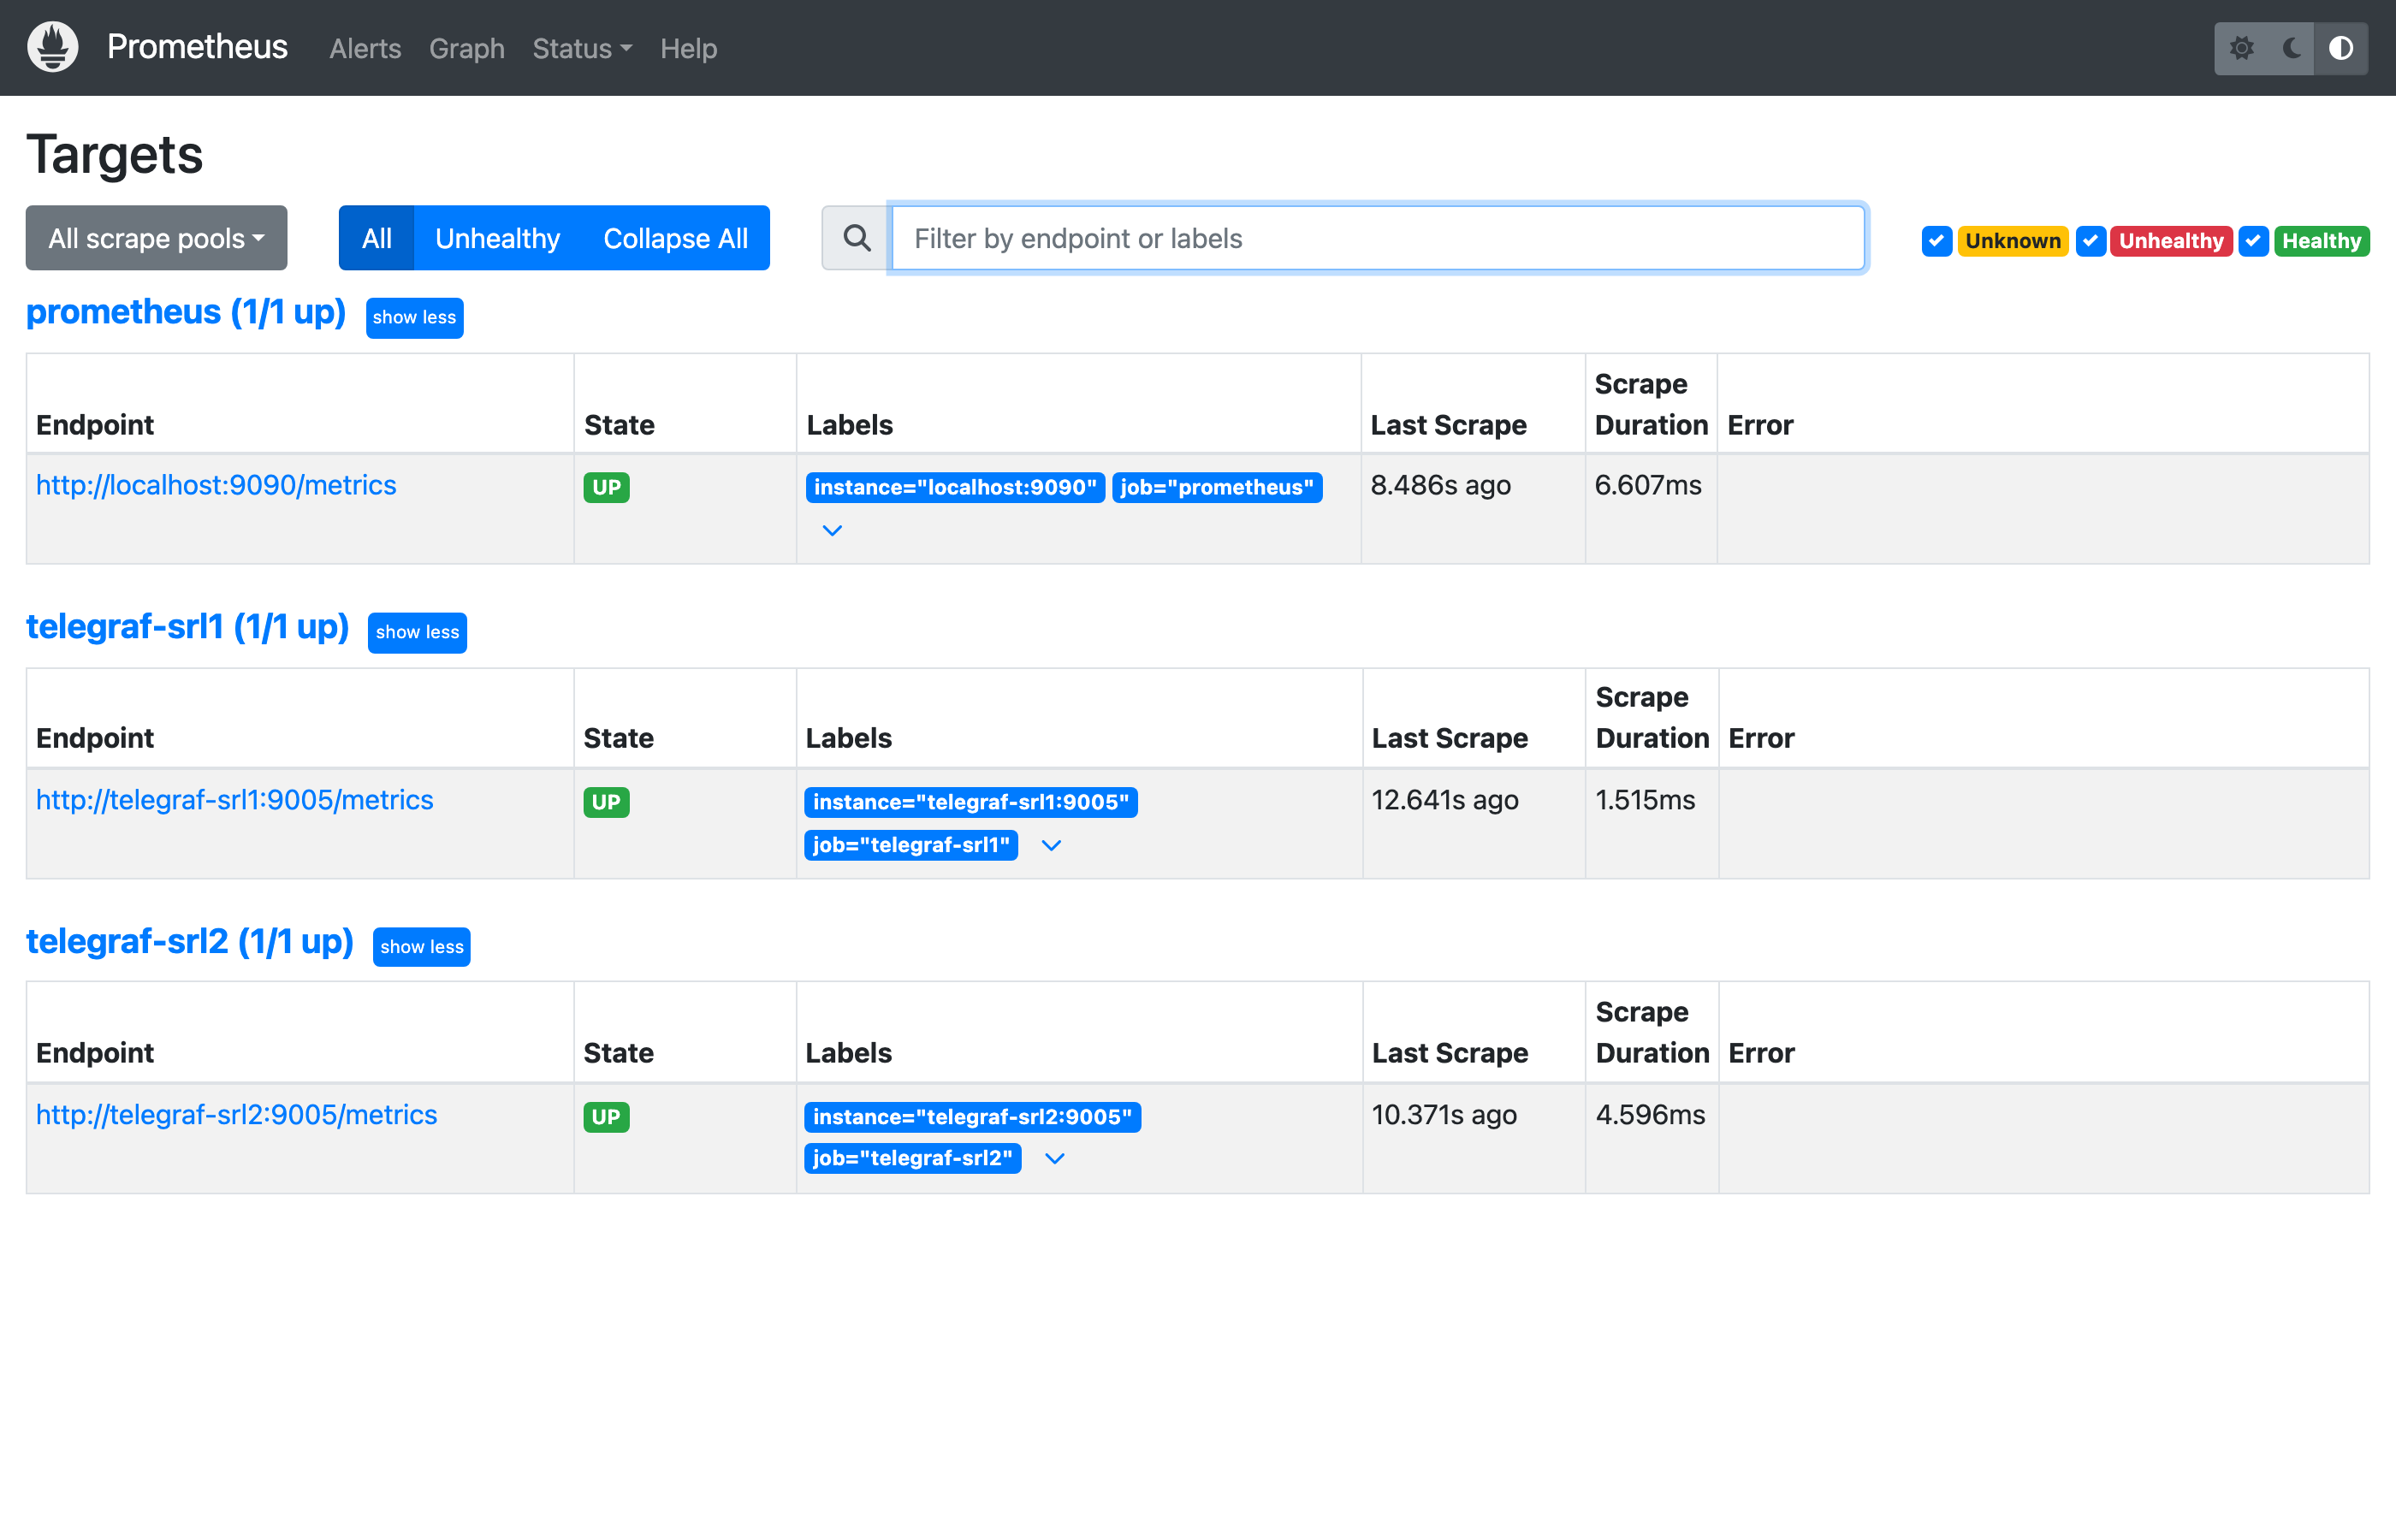
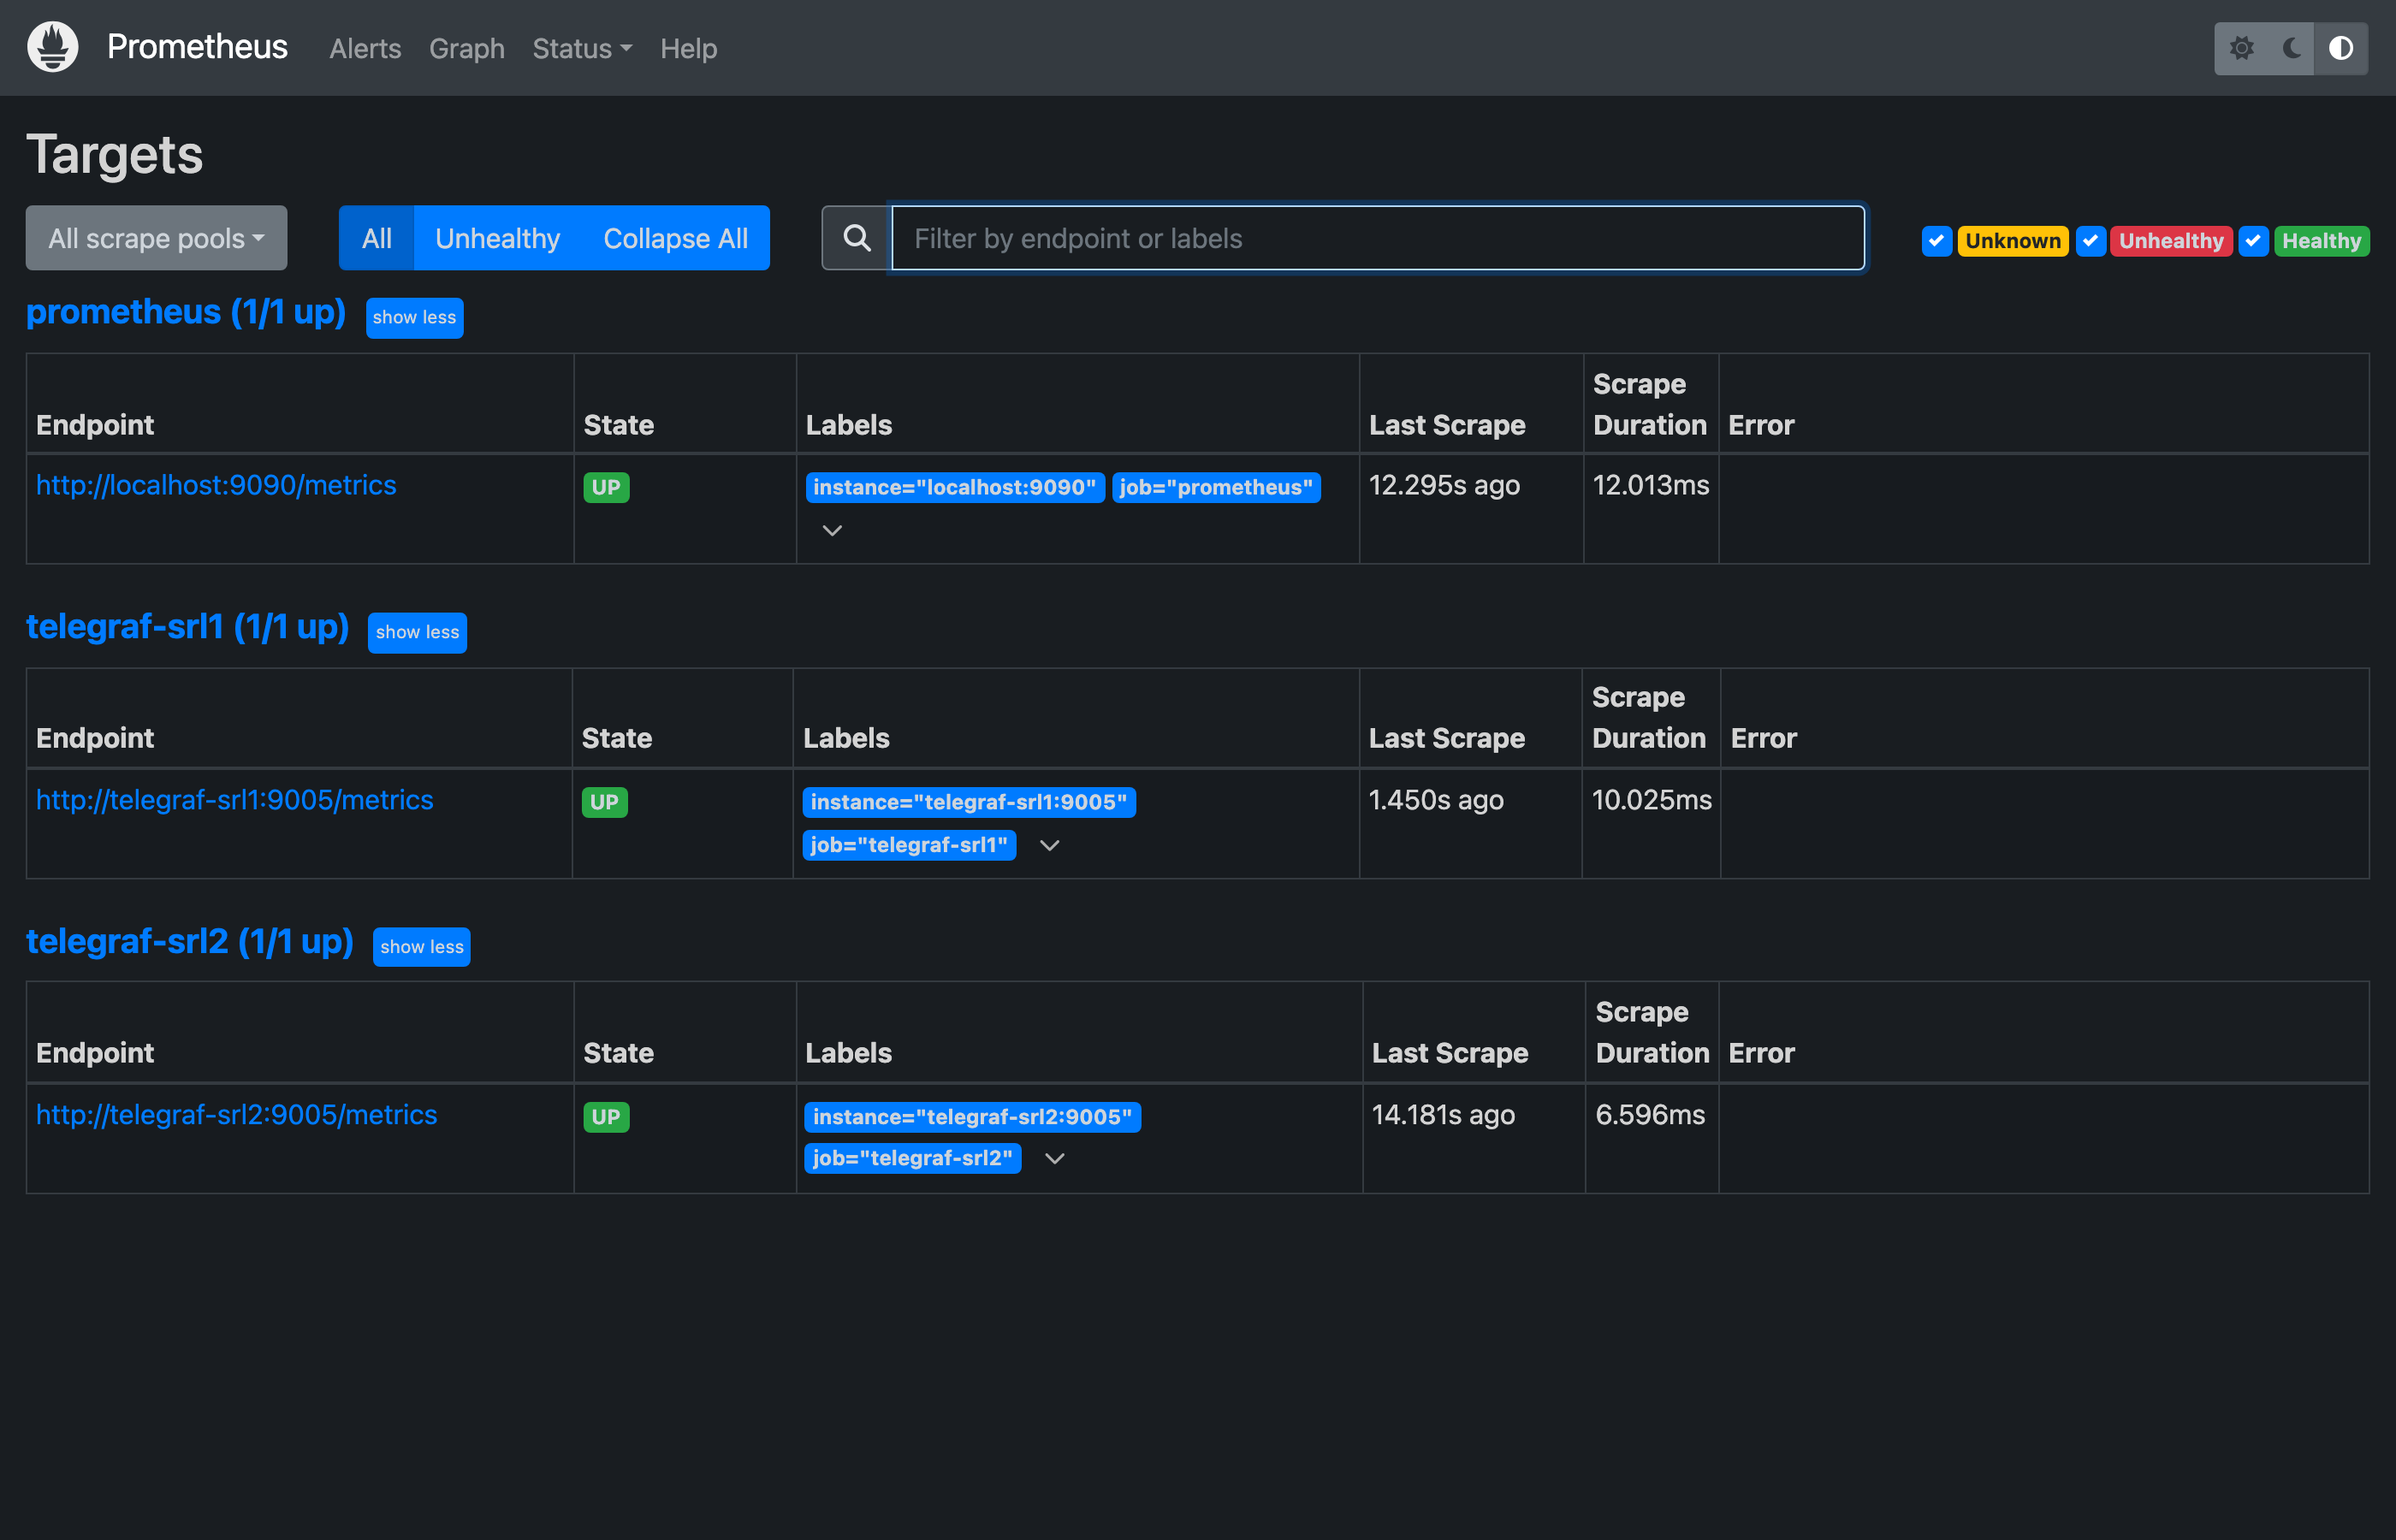
localhost:9090/targets. Three jobs in this lab: prometheus scraping itself, telegraf-srl1, and telegraf-srl2. All green UP badges is what you want; one DOWN is the silent root cause of half the "my dashboard is empty" tickets.If either says DOWN, the rest of the lab breaks silently. The first thing to check when "my dashboard is empty" — far more often a target issue than a query issue.
Queries to try
Open the query browser at http://localhost:9090/graph. These three queries are the spine of Part 1:
Returns one series per {device, name} interface pair. 1 is up, 2 is down — the SR Linux convention. Two series are stuck at 2: one per device, both on ethernet-1/11 (the always-broken interface in the lab).
BGP per-peer operational state on srl1. The lab maps 1 to established and 5 to active (degraded, retrying) — the gNMI/openconfig convention. One row should be stuck at 5 (the broken peer 10.1.99.2).
Every alert Prometheus has evaluated as firing in the last minute. This is the same set Alertmanager has live.
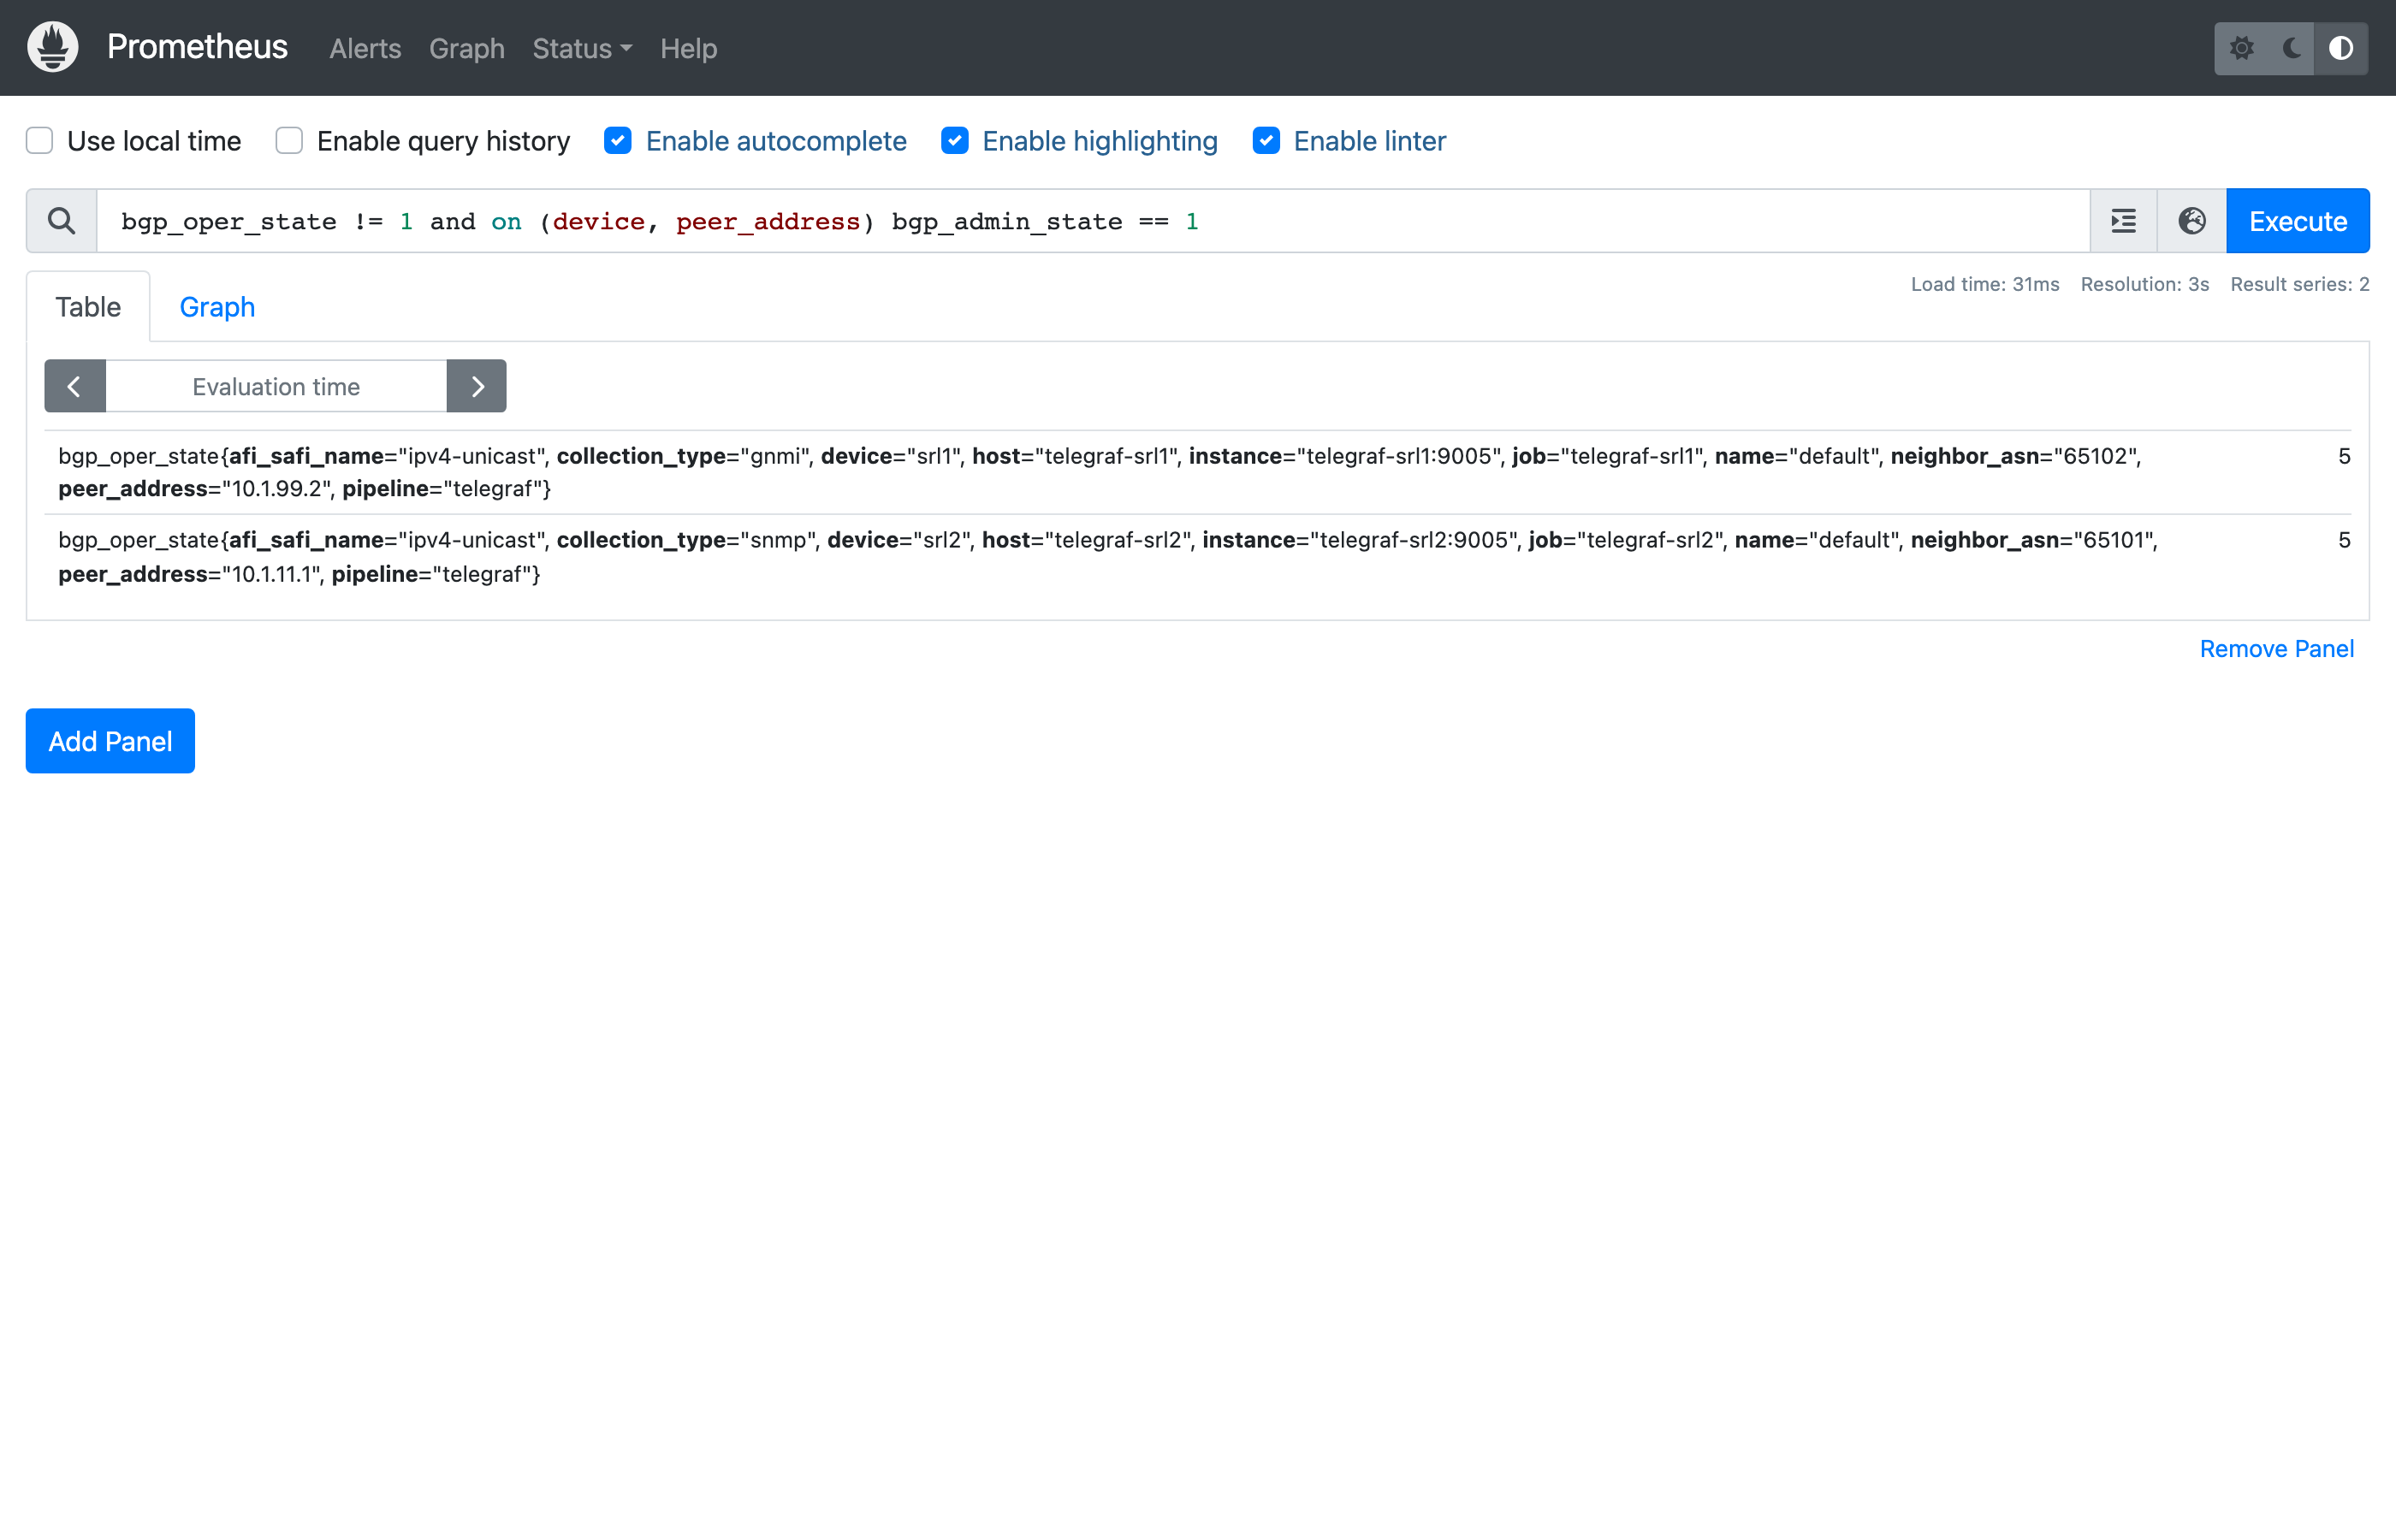
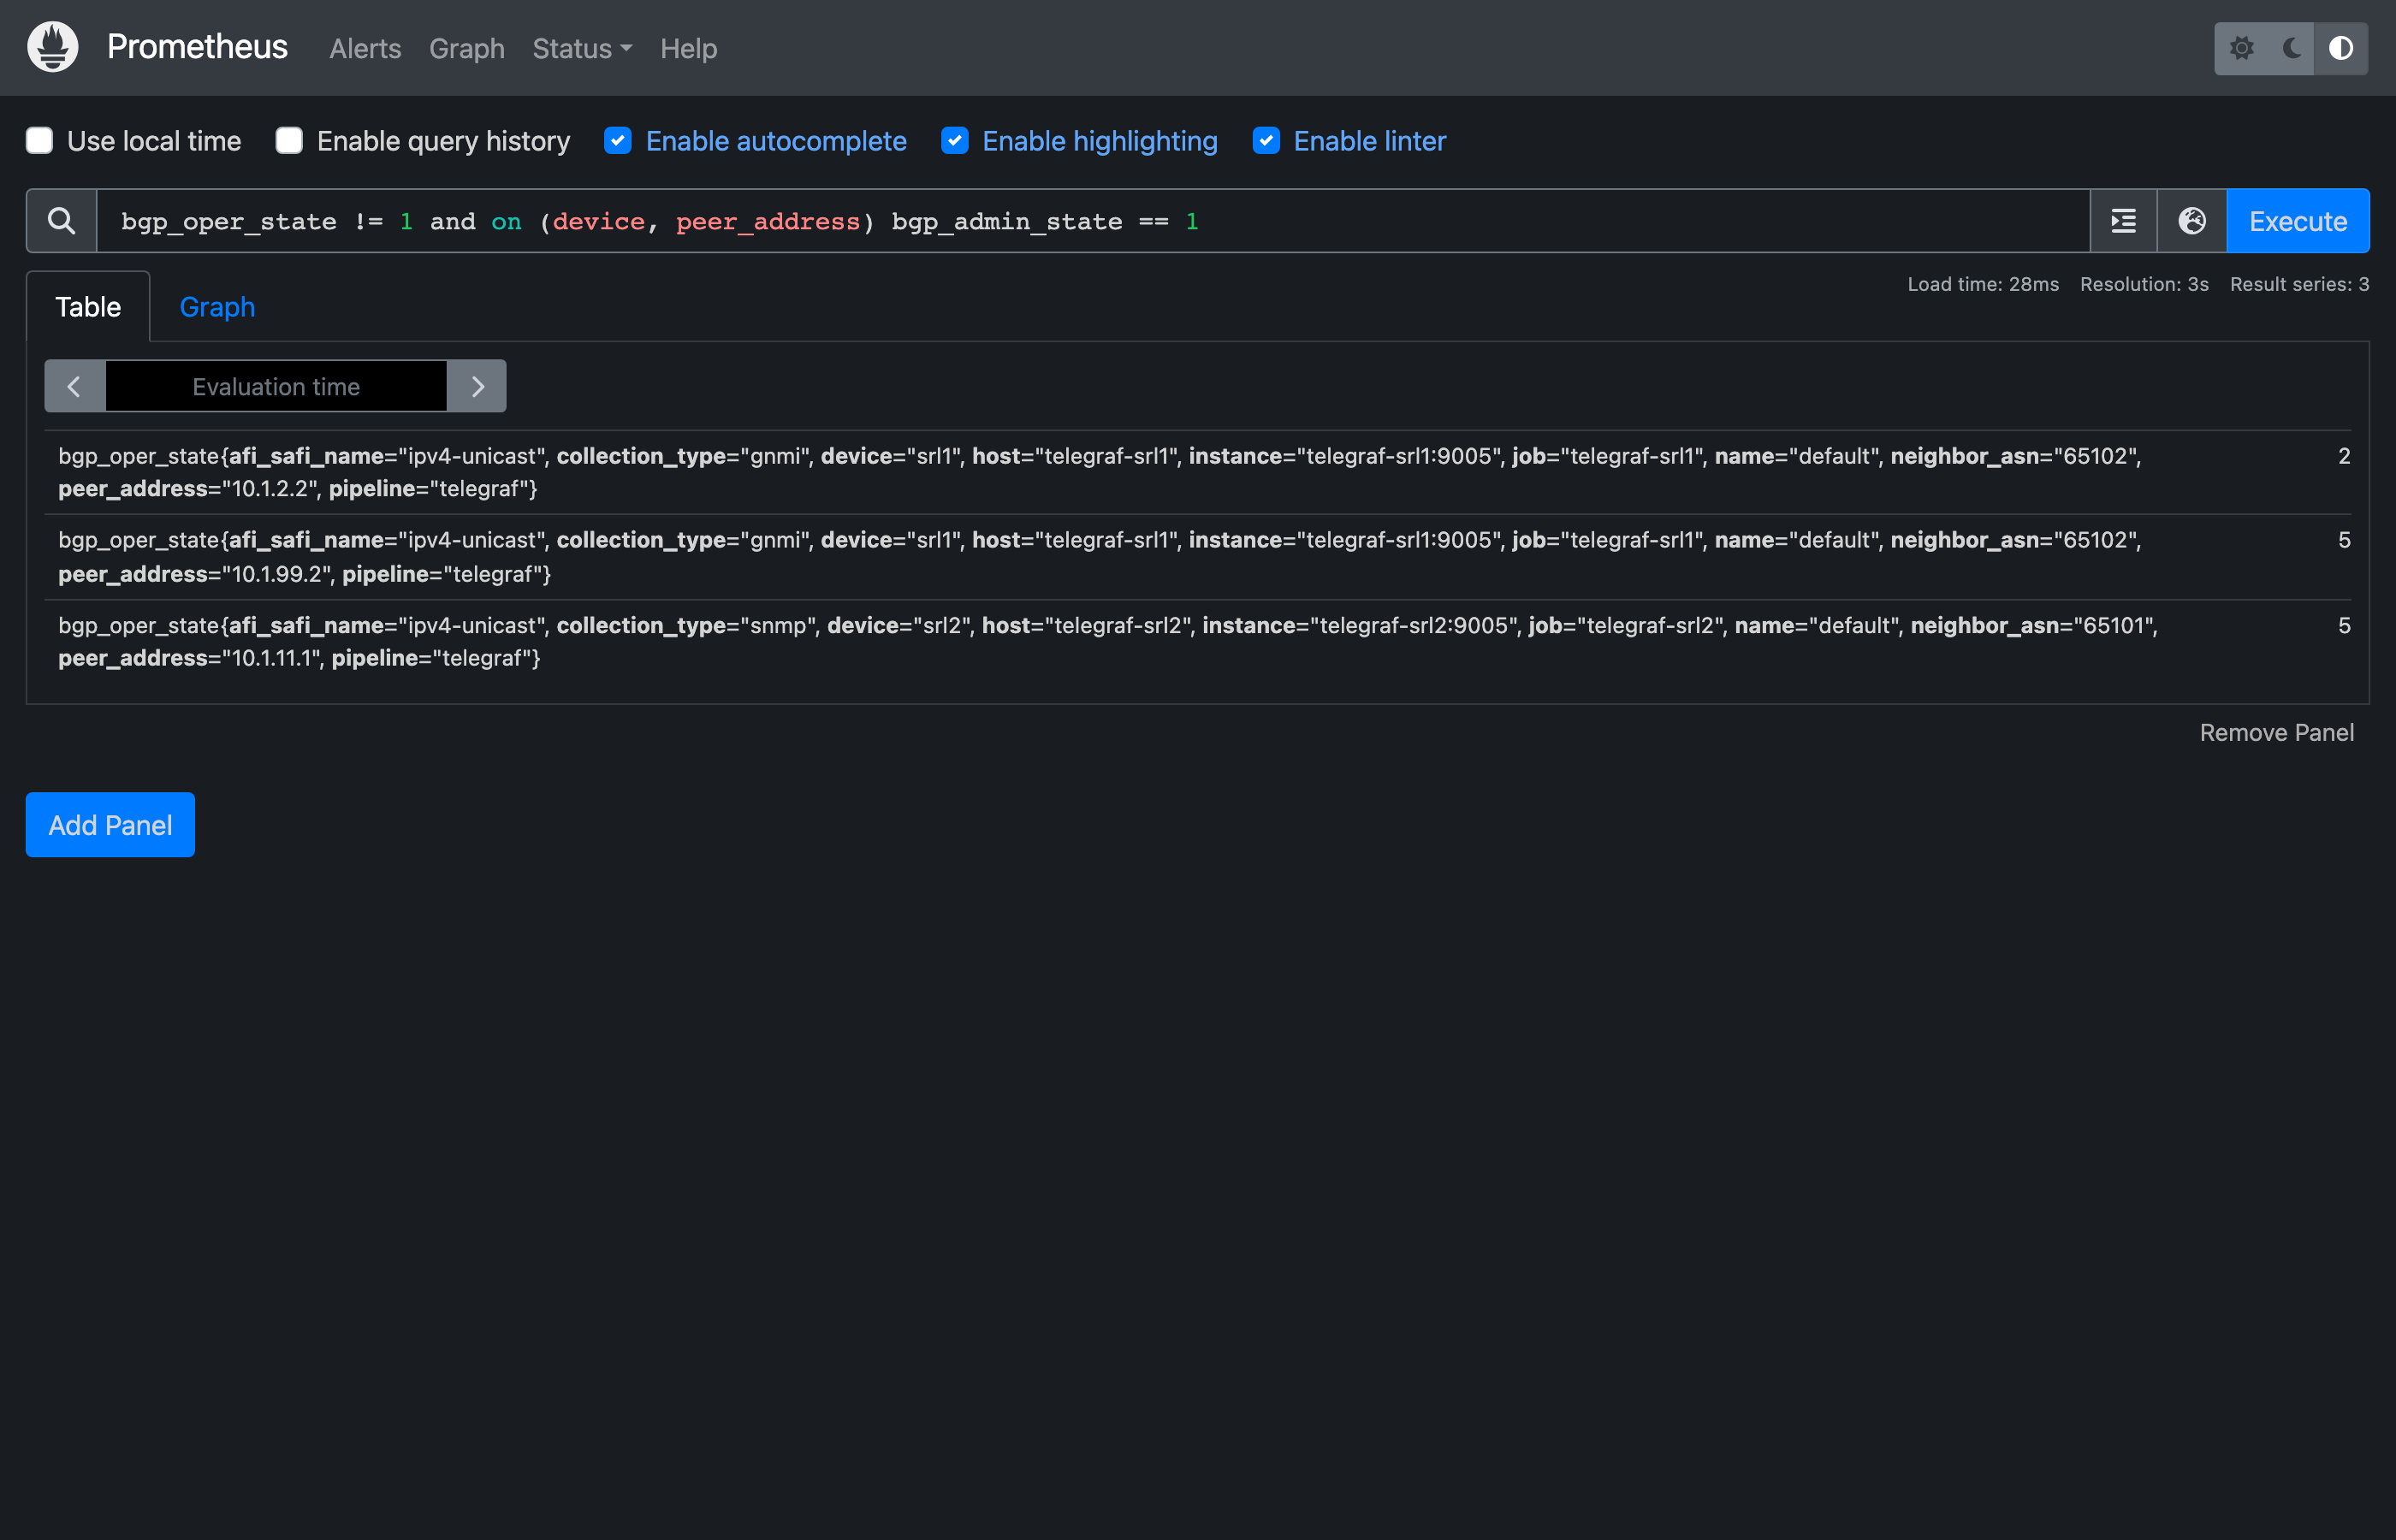
localhost:9090/graph. The intent-vs-reality query from Part 1, evaluated against the live lab. Two rows — both broken peers — with the oper_state=5 value preserved by the and on (...) join.Alerts and rules
The alerts page (http://localhost:9090/alerts) groups every rule by file. inactive is normal — the rule is being evaluated, condition just isn't met. pending means the condition matched but hasn't been true for the rule's for: duration yet. firing means the alert has been sent to Alertmanager.
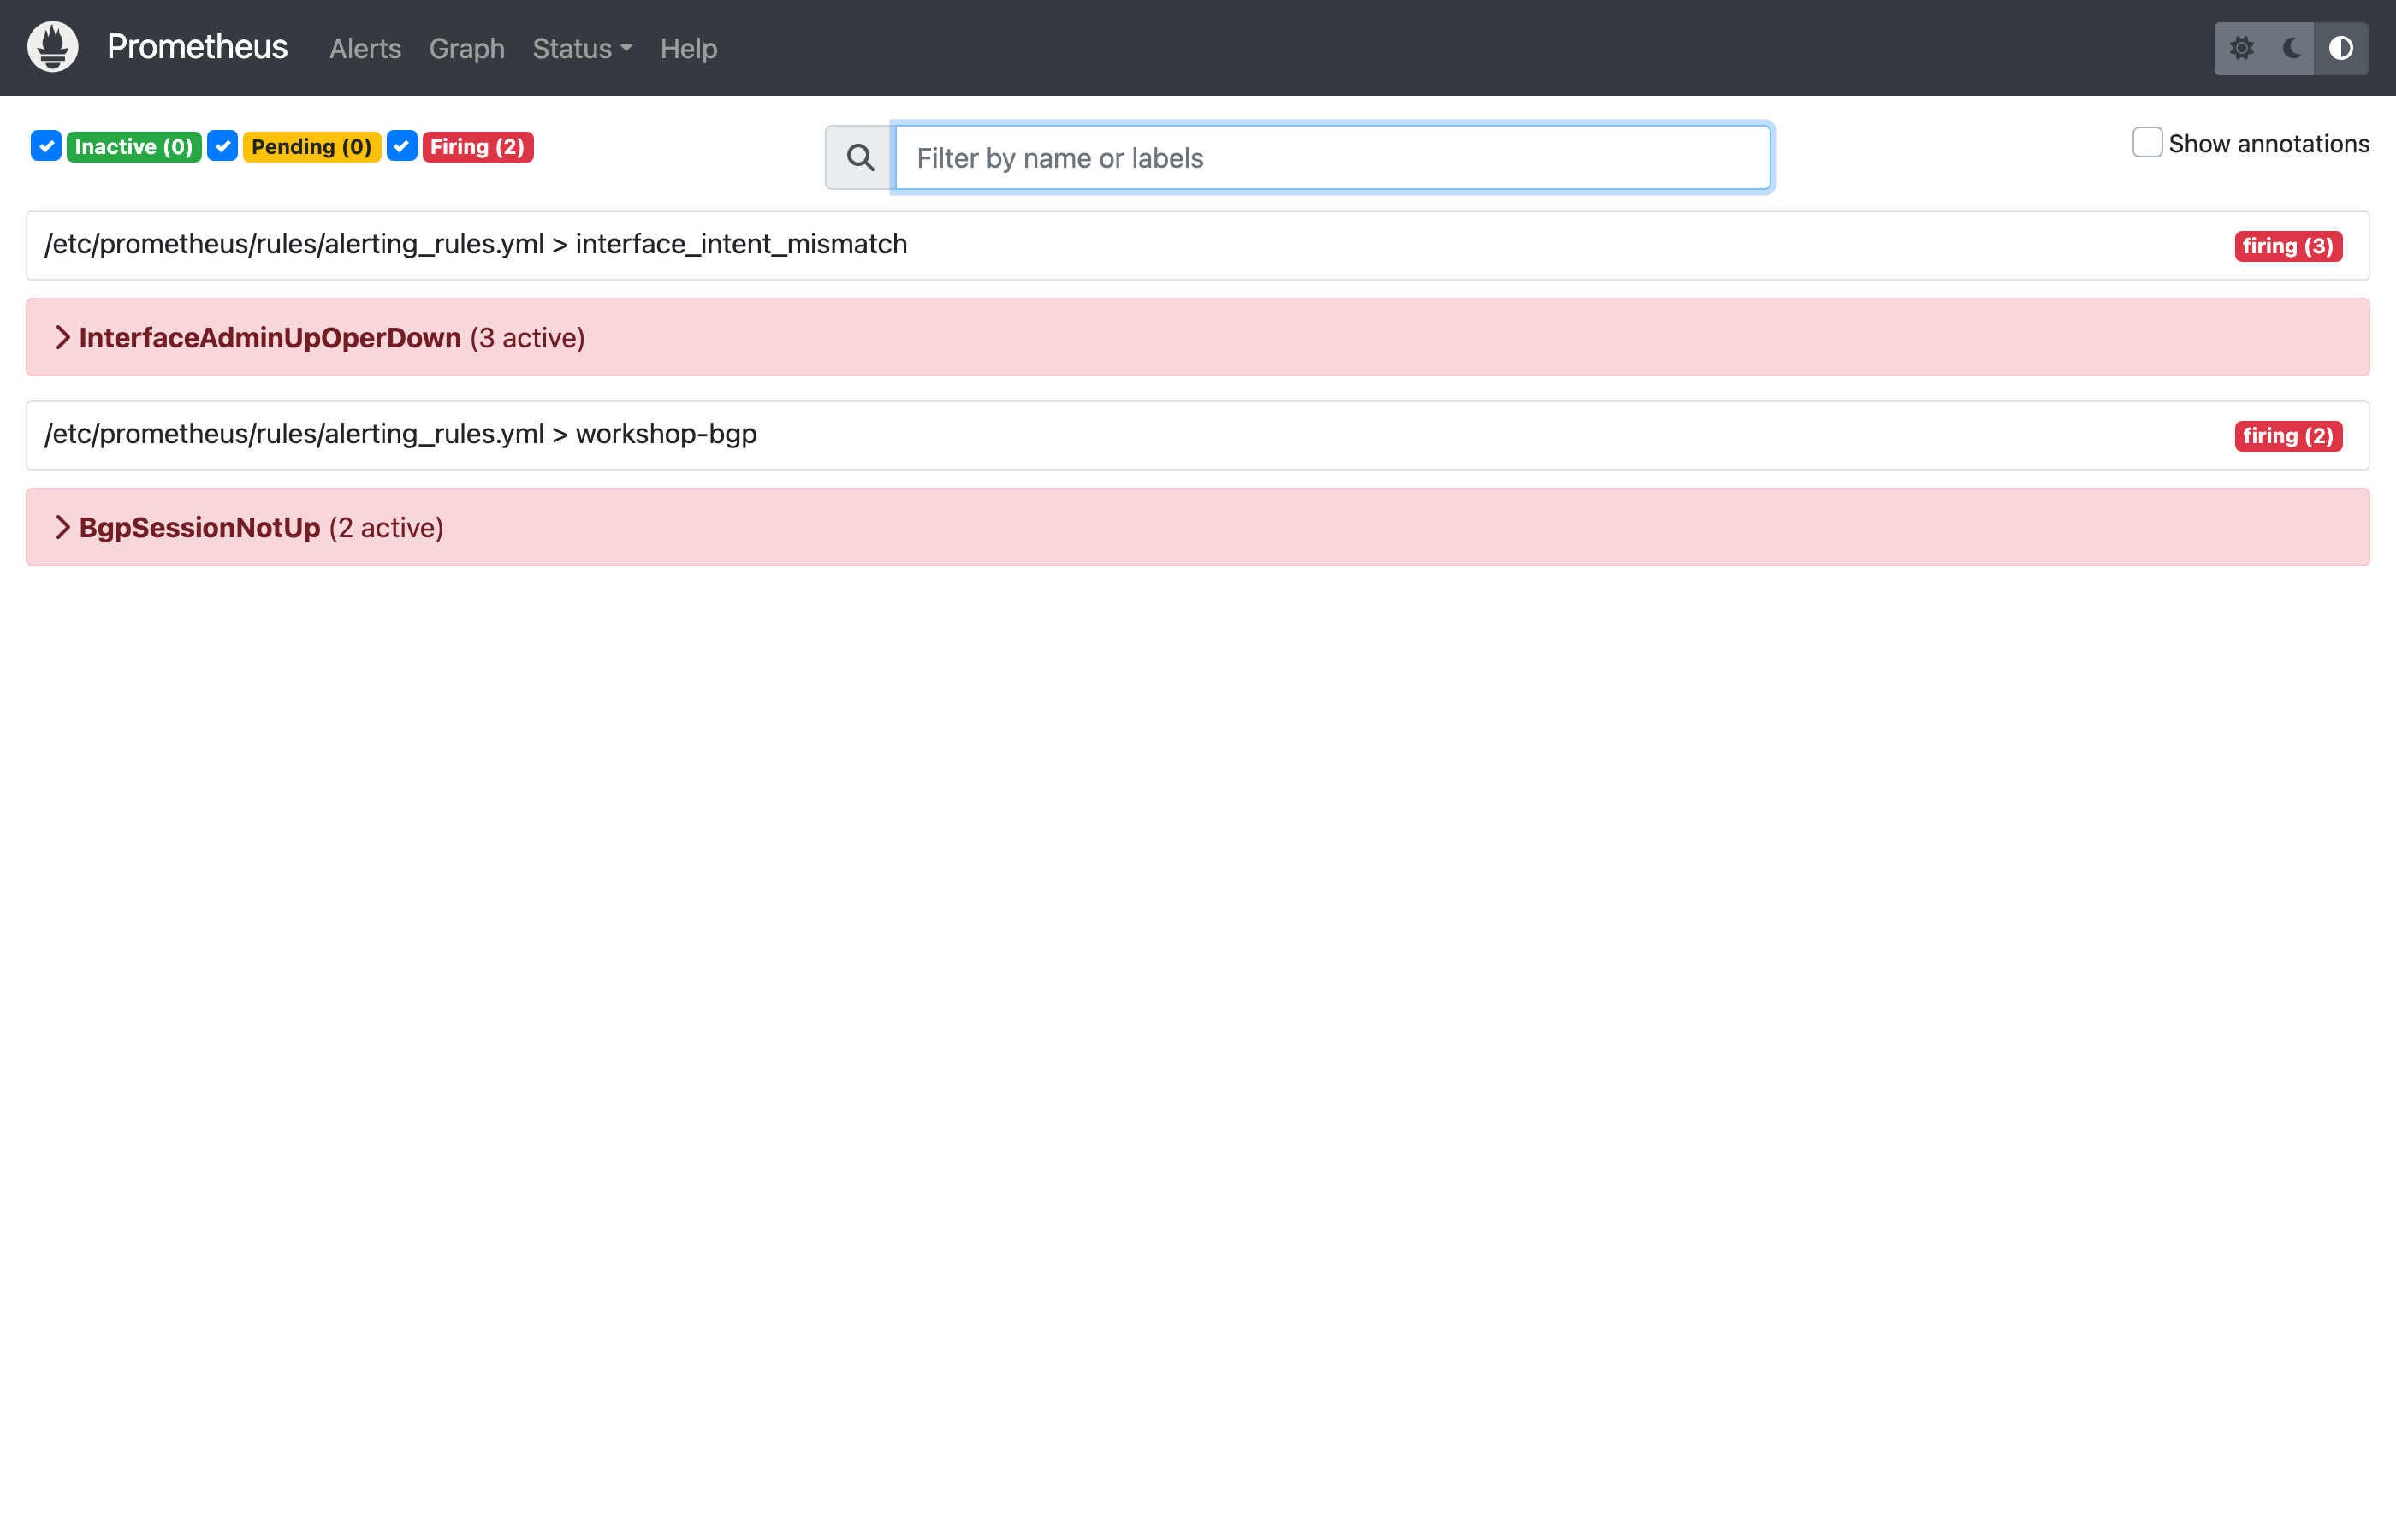
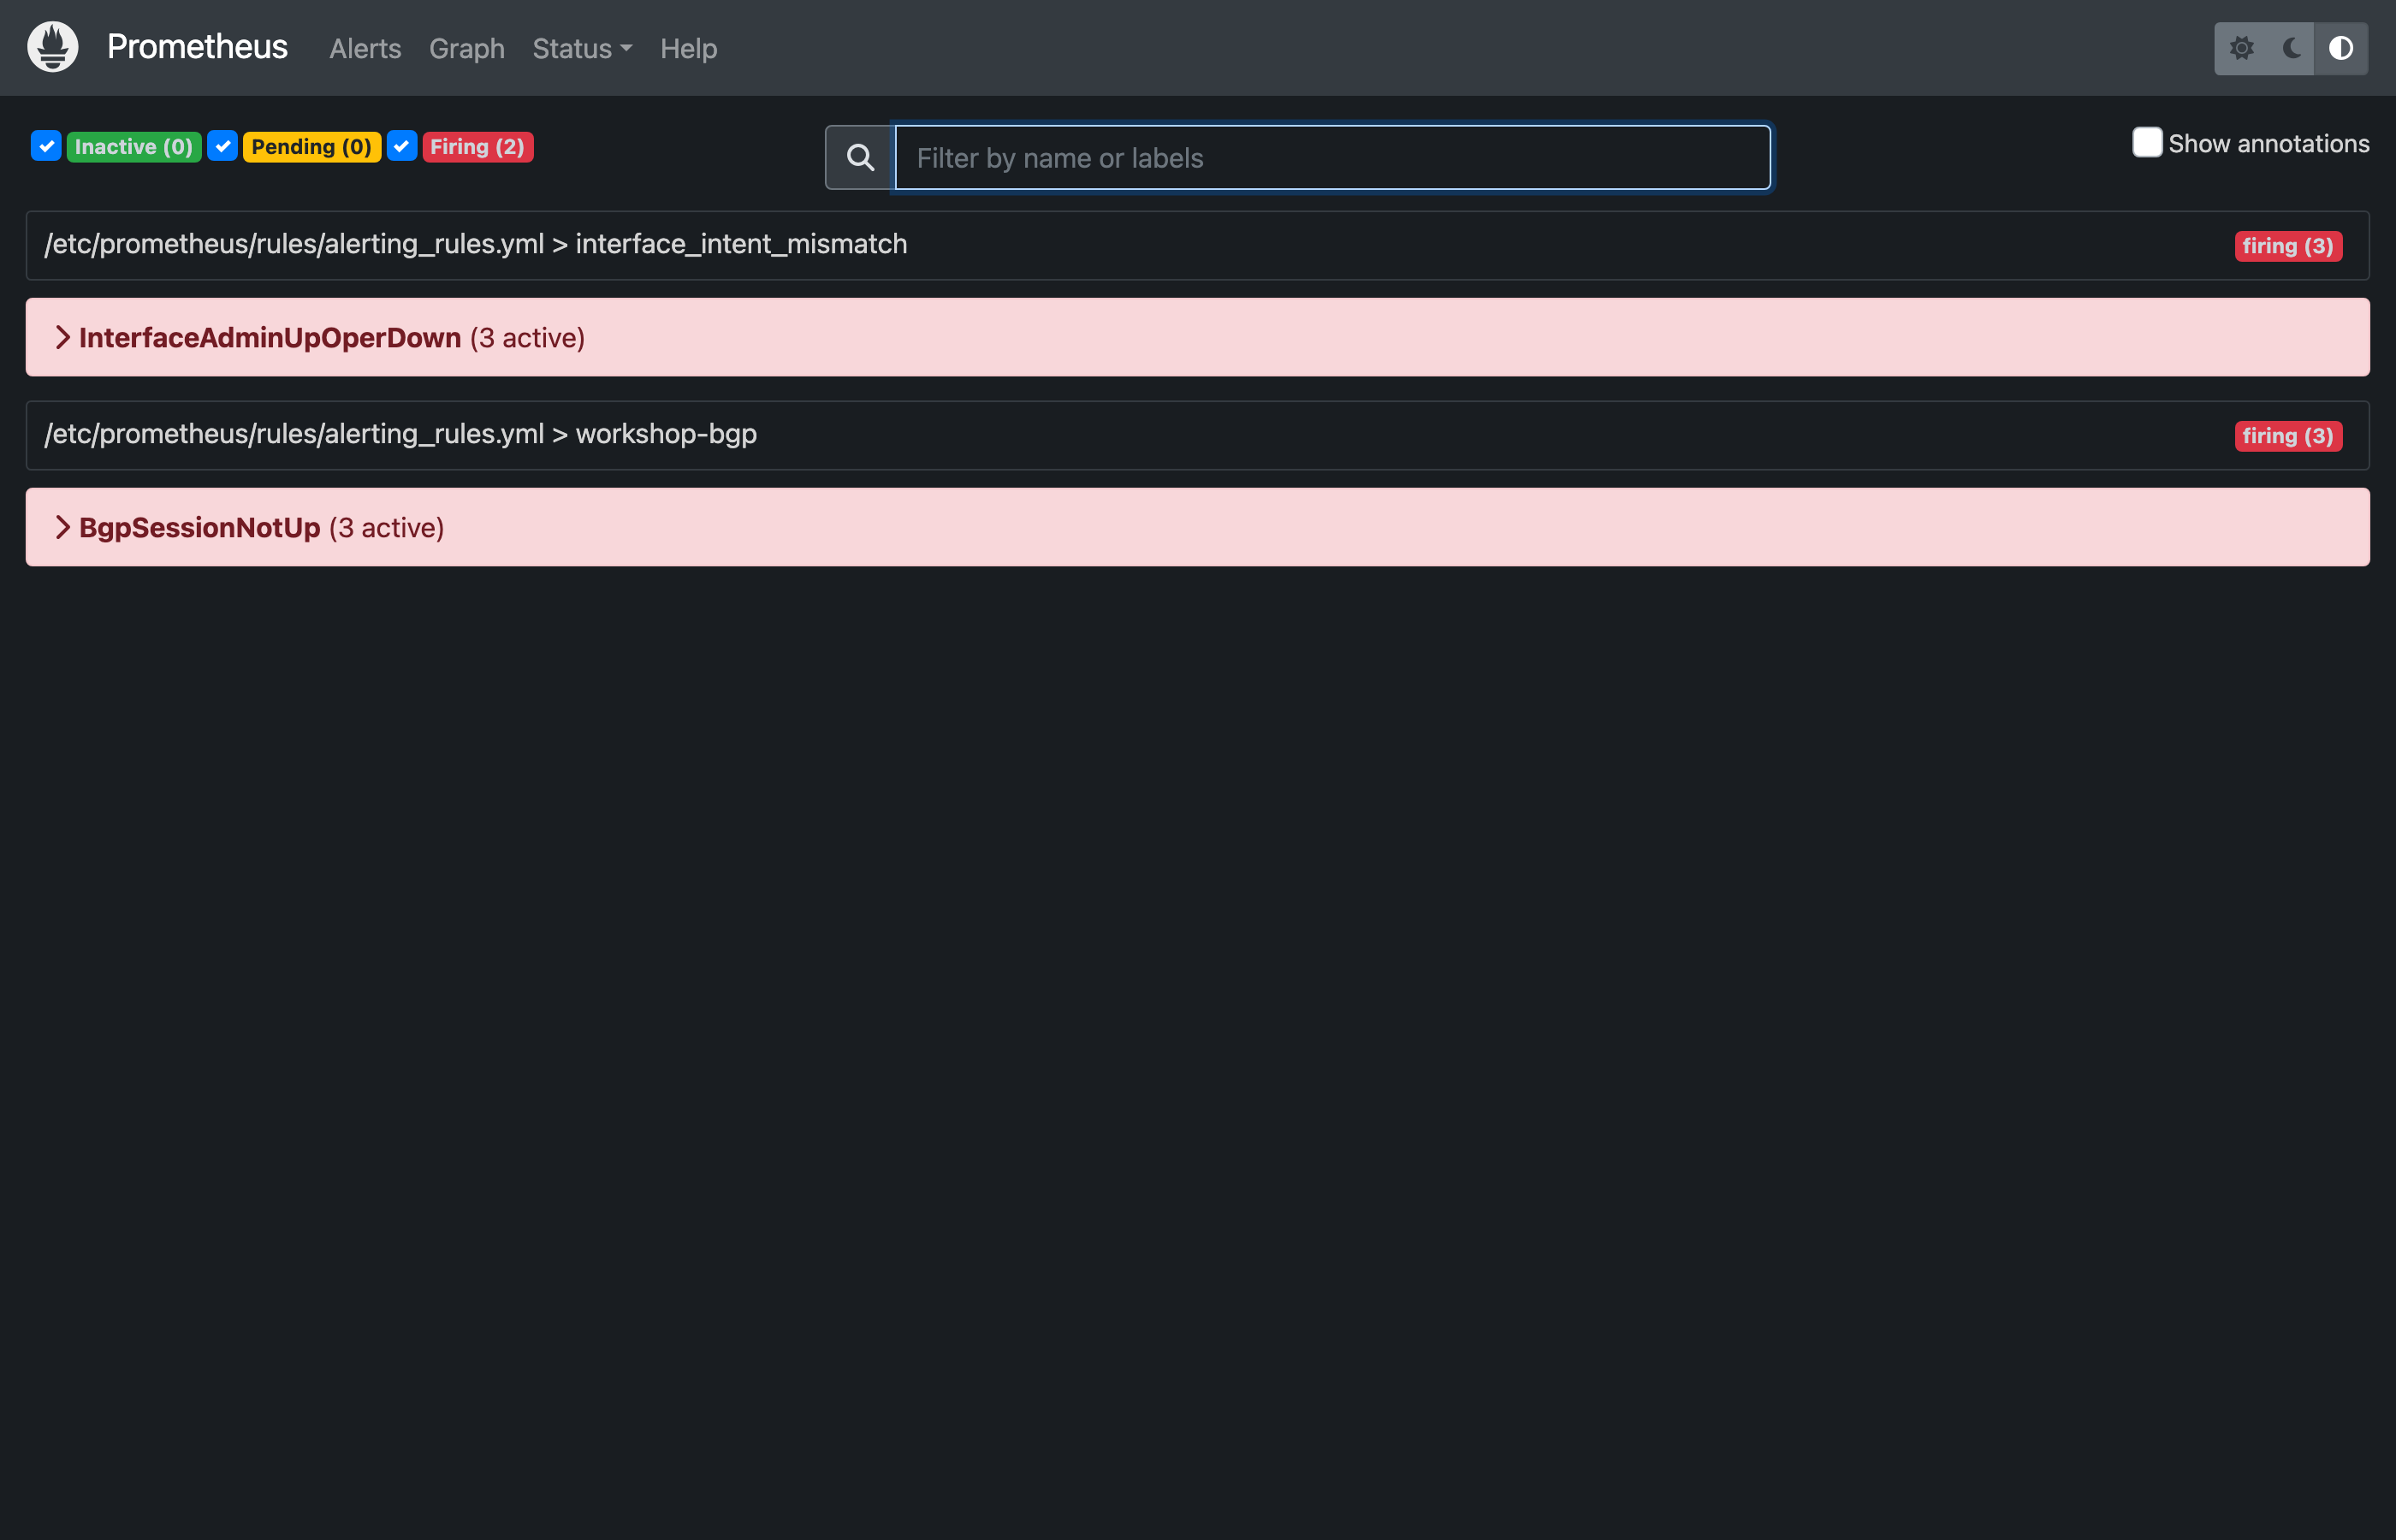
localhost:9090/alerts. Rule files grouped by source (alerting_rules.yml, recording_rules.yml) with each rule's current state badge.The rules page (http://localhost:9090/rules) is where recording rules live. The workshop ships several — device:network_traffic_in_bps:rate_2m precomputes a 2-minute traffic rate per device so dashboards don't re-derive it for every panel. If a rule's "Health" column is err, expand it to see the query and the error.
Where you'll see this in the workshop
- Part 1 — the query browser is open the whole time.
- Part 2 — when you build the flap-rate panel in Grafana, you're writing PromQL that runs against this Prometheus.
- Part 3 —
BgpSessionNotUpis one of the rules on this page; firing alerts here become webhook payloads to Prefect.
Alertmanager — the alert router and silence store
What this is
Alertmanager is the deduplication-and-routing layer that sits between Prometheus and wherever alerts actually need to go (email, Slack, PagerDuty, a webhook). Prometheus decides whether a condition is firing; Alertmanager decides who hears about it, how often, and grouped how. It also stores silences — time-bounded mute rules that suppress matching alerts without changing the underlying rule. Think of it as a smarter Nagios notifier: same job (turn an alert into a page), but with deduplication, label-based routing, grouping, and silences built in.
In this workshop, Alertmanager at http://localhost:9093 receives every firing alert from Prometheus, deduplicates and groups them, and routes them out to the FastAPI webhook that hands off to a Prefect flow. The Prefect quarantine flow uses the silence API to mute alerts it's already containing.
The two pages you'll actually use
| Page | URL | What it tells you |
|---|---|---|
| Alerts | http://localhost:9093/#/alerts | Every active alert grouped by labels, with Active / Suppressed state. |
| Silences | http://localhost:9093/#/silences | Every silence the workshop has created, with creator, matchers, and expiry. |
Alerts page
Each active alert shows its labels (alertname=BgpSessionNotUp, device=srl1, peer_address=10.1.99.2, …) plus a state badge. Active means the alert is being routed normally. Suppressed means a matching silence is in effect — for this workshop, that almost always means the Prefect quarantine flow caught the alert, decided it warranted containment, and silenced it for 20 minutes while it worked.
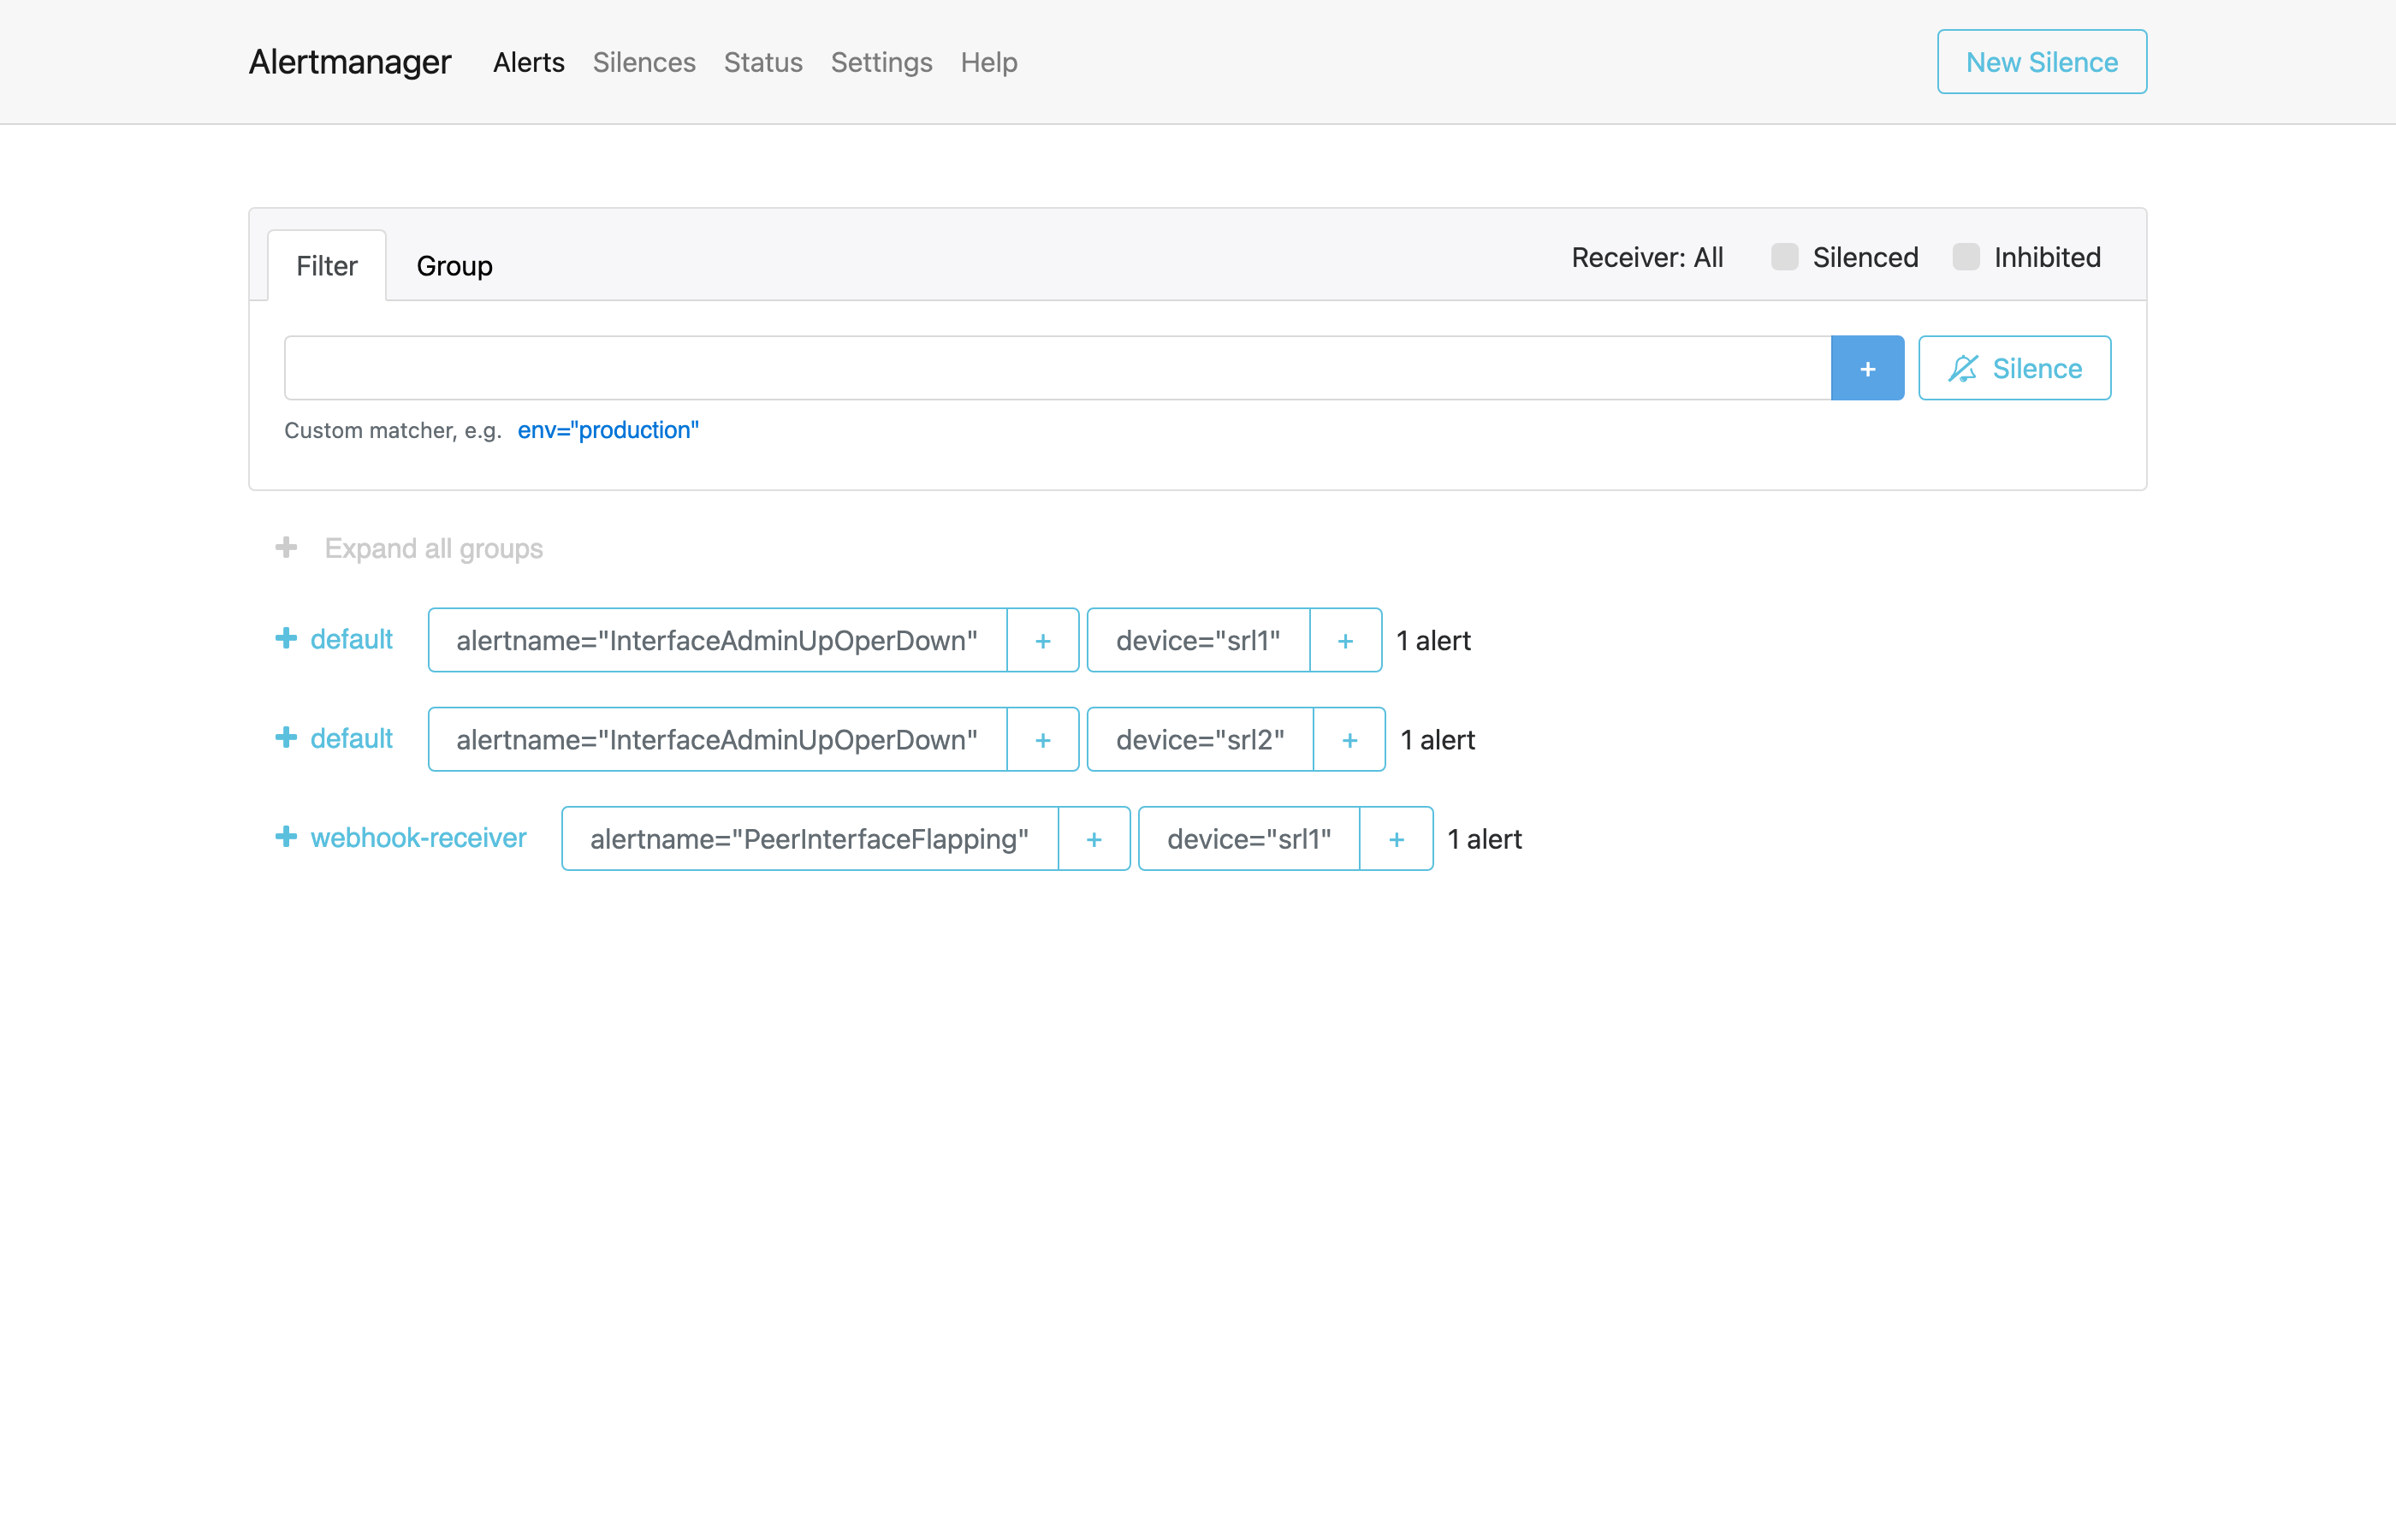
localhost:9093/#/alerts. Groups by routing target — default (the two InterfaceAdminUpOperDown alerts that didn't match the BGP webhook route) and webhook-receiver (the PeerInterfaceFlapping that did). Click any group to expand the matching alerts and their full label set.You can click any alert to expand the full label set. The labels are what the Prefect flow reads when it asks Infrahub "is this peer expected up?" — device and peer_address are the keys.
Silences page
The silences page is the auditable record of every containment action. When the quarantine flow runs successfully on an alert, you'll see a silence here with:
- Matchers:
alertname=BgpSessionNotUp,device=srl1,peer_address=10.1.99.2 - Creator:
prefect-workshop - Comment:
Workshop quarantine: suppress repeat notifications while investigating. - Ends: 20 minutes after creation
You can manually expire a silence here too — the Expire button removes it immediately, and the alert returns to Active on the next evaluation cycle.
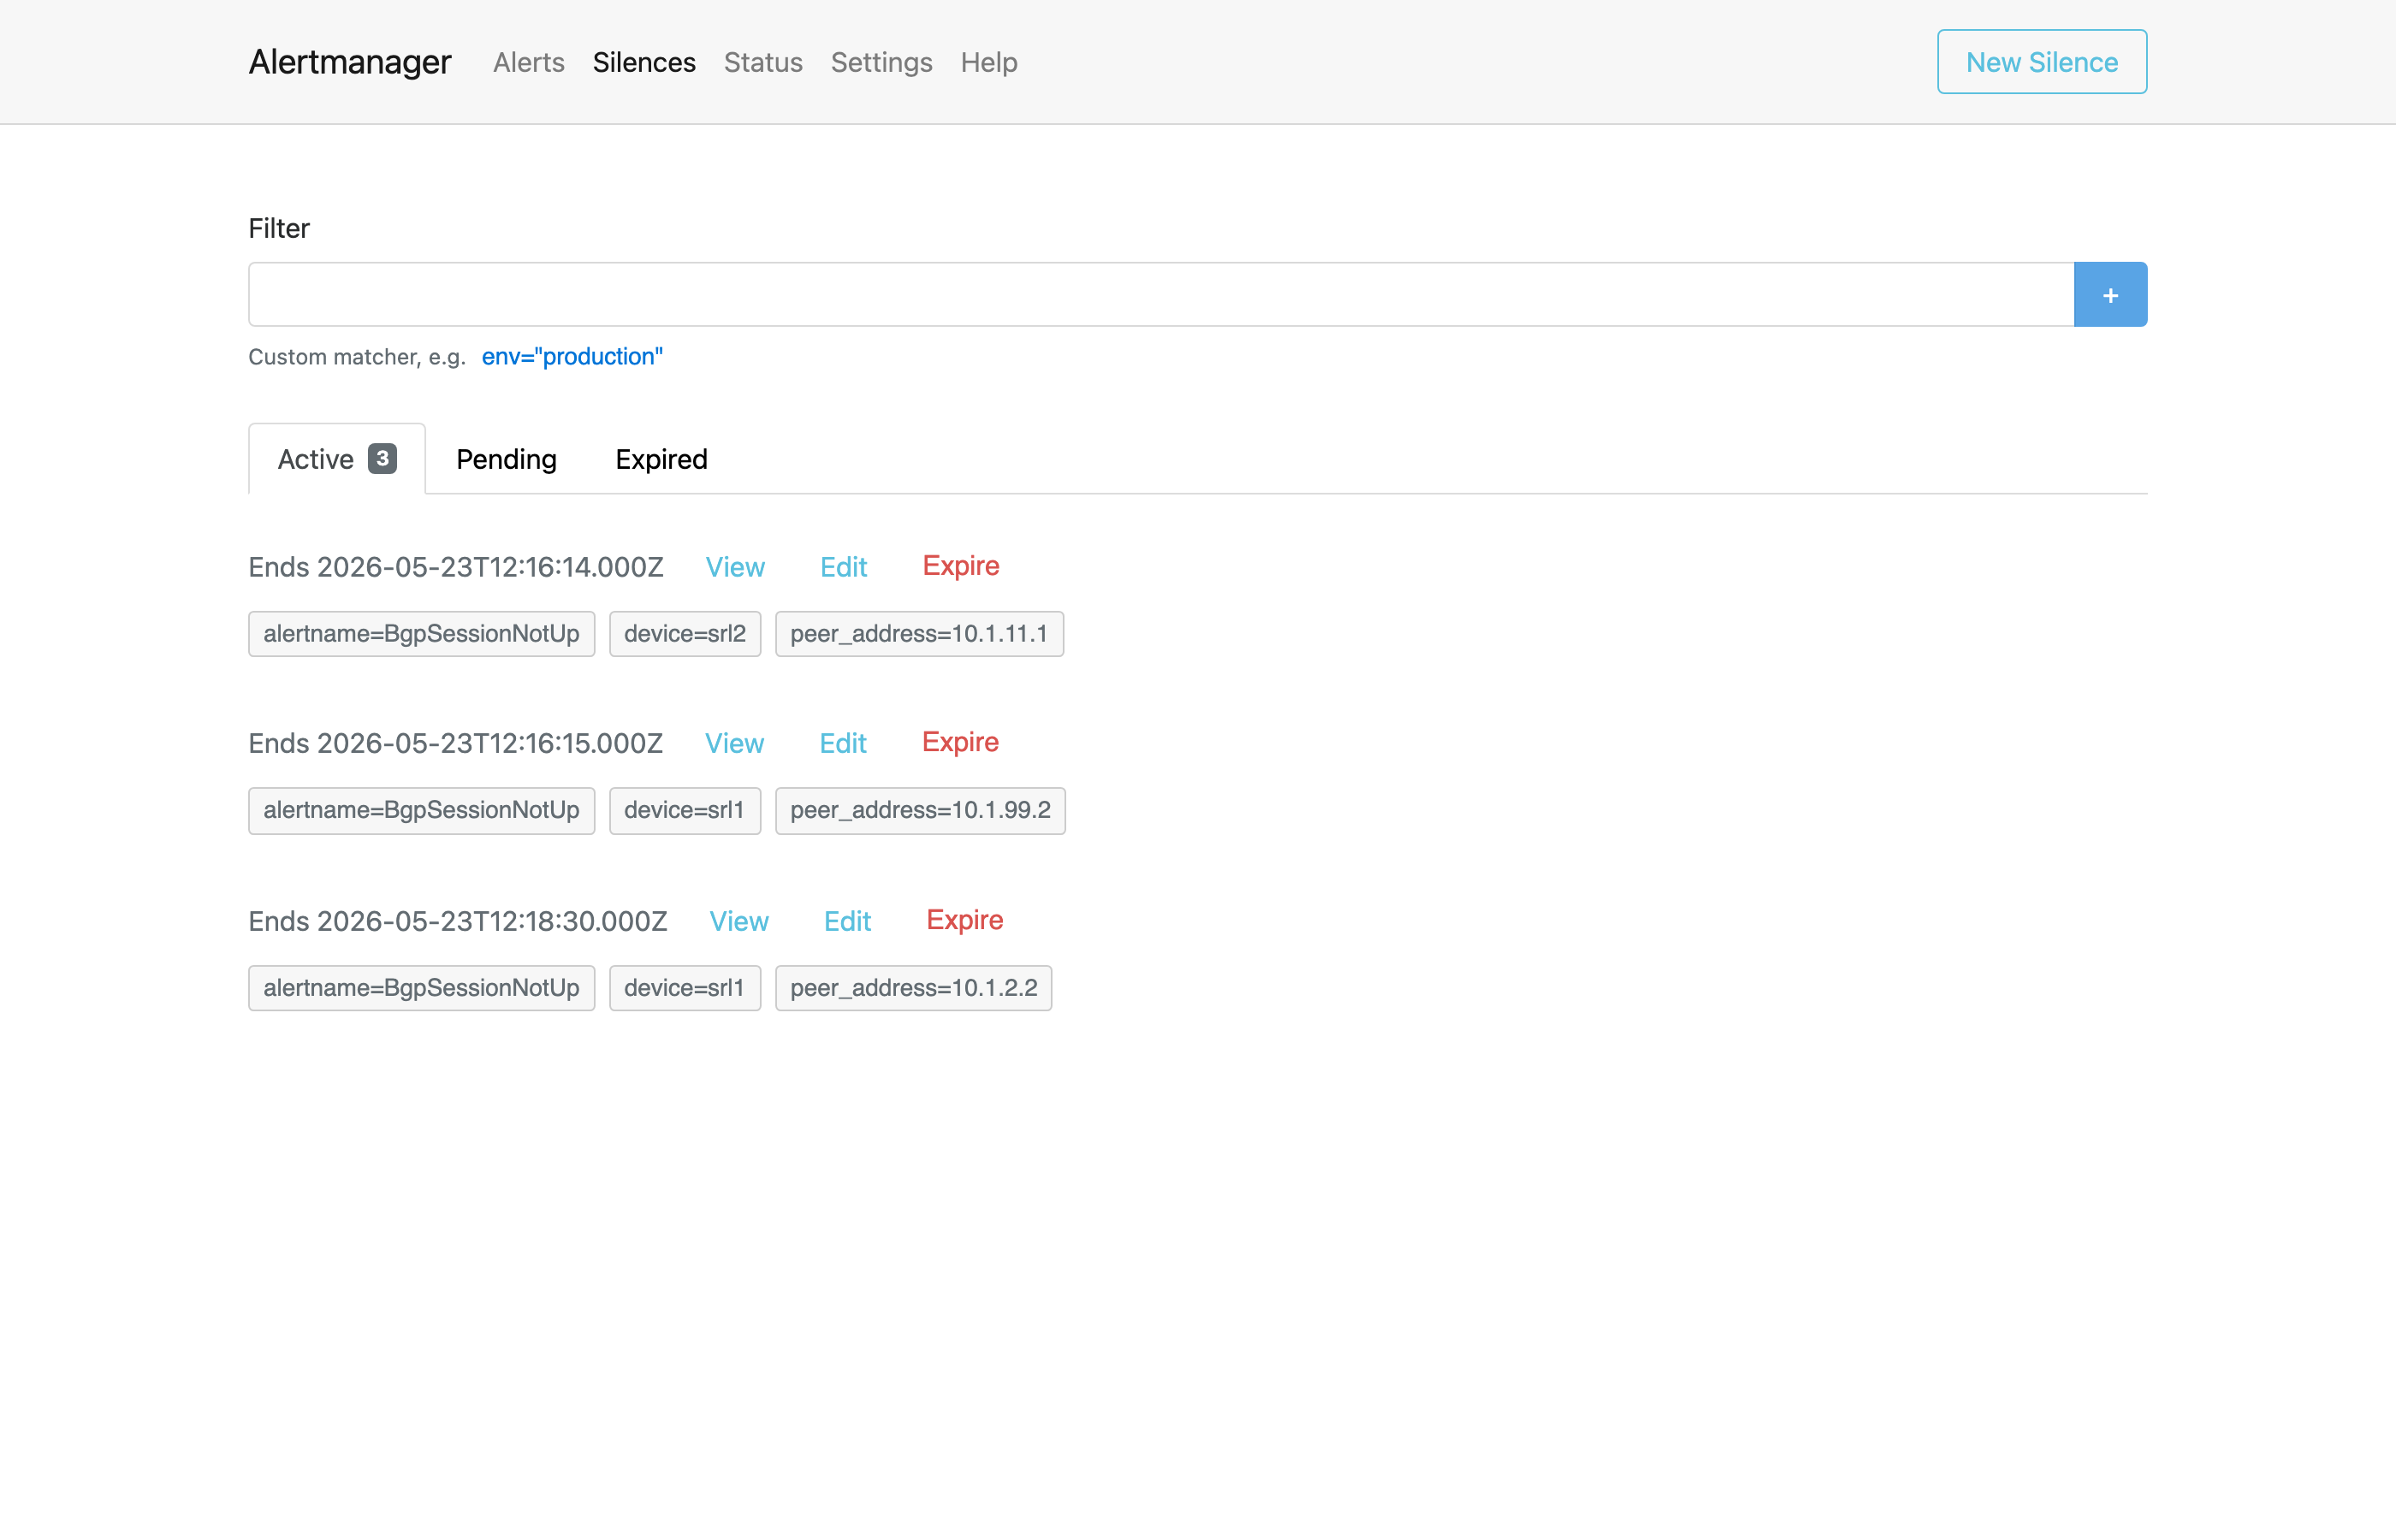
localhost:9093/#/silences. Three active silences in this snapshot: the two always-broken peers (srl1→10.1.99.2, srl2→10.1.11.1) that the Prefect flow quarantined on startup, plus a fresh one for srl1→10.1.2.2 from a cascade flap-interface. Each shows its matchers, expiry timestamp, and an Expire button.CLI equivalents
The nobs autocon5 alerts command renders the alerts page as a table:
Useful when you just want a quick "what's firing right now?" without leaving the terminal.
Where you'll see this in the workshop
- Part 1 — you check that morning's two
BgpSessionNotUpalerts are here, then trace them backwards to a single PromQL query. - Part 3 — the entire flow lives in this page. Every
try-itrun either creates a silence (quarantine) or doesn't (skip/audit), and the silence is the visible evidence.
Grafana — dashboards and Explore
What this is
Grafana is the visualization layer — dashboards, ad-hoc query exploration, and one UI on top of many backends. You've almost certainly seen one. In this workshop, Grafana at http://localhost:3000 has three datasources pre-wired: Prometheus for metrics, Loki for logs, and Infrahub (GraphQL via the Infinity datasource) for intent. Dashboards and the Explore mode can query any of them without setup.
Logging in
Default credentials are admin / admin. If you set GRAFANA_ADMIN_PASSWORD in .env before bringing the stack up, use that instead — see docs/env-lifecycle.md for how secrets flow in. On the very first login Grafana may prompt you to change the password; click Skip — the workshop guides assume the default password persists across restarts.
Pre-provisioned dashboards
| Dashboard | URL | What it's for |
|---|---|---|
| Workshop Home | http://localhost:3000/d/workshop-home | The landing page. Currently firing alerts, recent event feed, a list of starter queries with one-click links into Explore. |
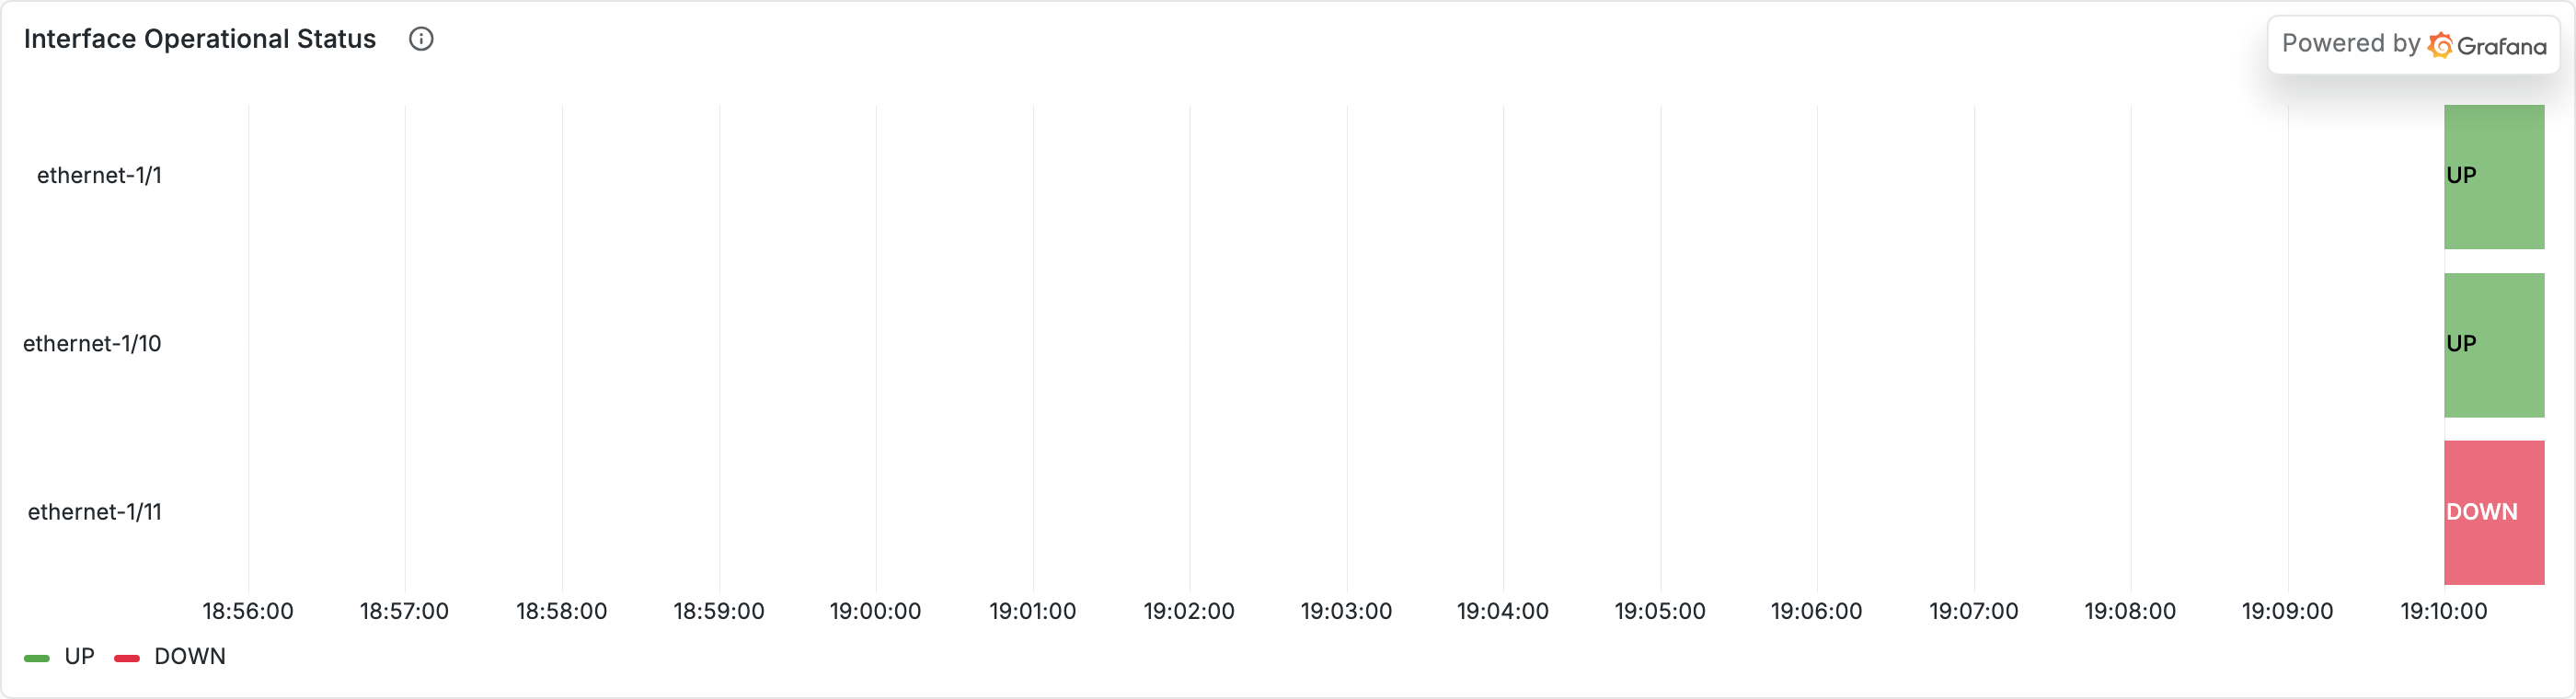
| Workshop Lab 2026 | http://localhost:3000/d/dfb5dpyjbh2wwa | Side-by-side panels for the day's exercises. Interface oper status timeline lives here. |
| Device Health | http://localhost:3000/d/c78e686b-138b-4deb-b6ae-3239dc10a162 | Per-device deep dive. BGP peer states, interface state, device-level CPU/memory/uptime. |
Your edits don't survive a full restart
All three dashboards are provisioned: Grafana reads their JSON definitions from workshops/autocon5/grafana/dashboards/*.json at startup rather than from its own database. The provisioning config sets editable: true, allowUiUpdates: true, so the UI lets you save changes — but those edits live only in Grafana's in-memory state. On any restart (nobs autocon5 restart grafana, nobs autocon5 down/up, container OOM, etc.) Grafana re-reads the YAML and your changes vanish.
This is the common production pattern: the YAML file is the source of truth, the UI is a scratchpad. The workshop guides assume the dashboards are in their shipped state, so if your panel layout starts looking weird, a restart grafana resets you cleanly.
What the panels look like
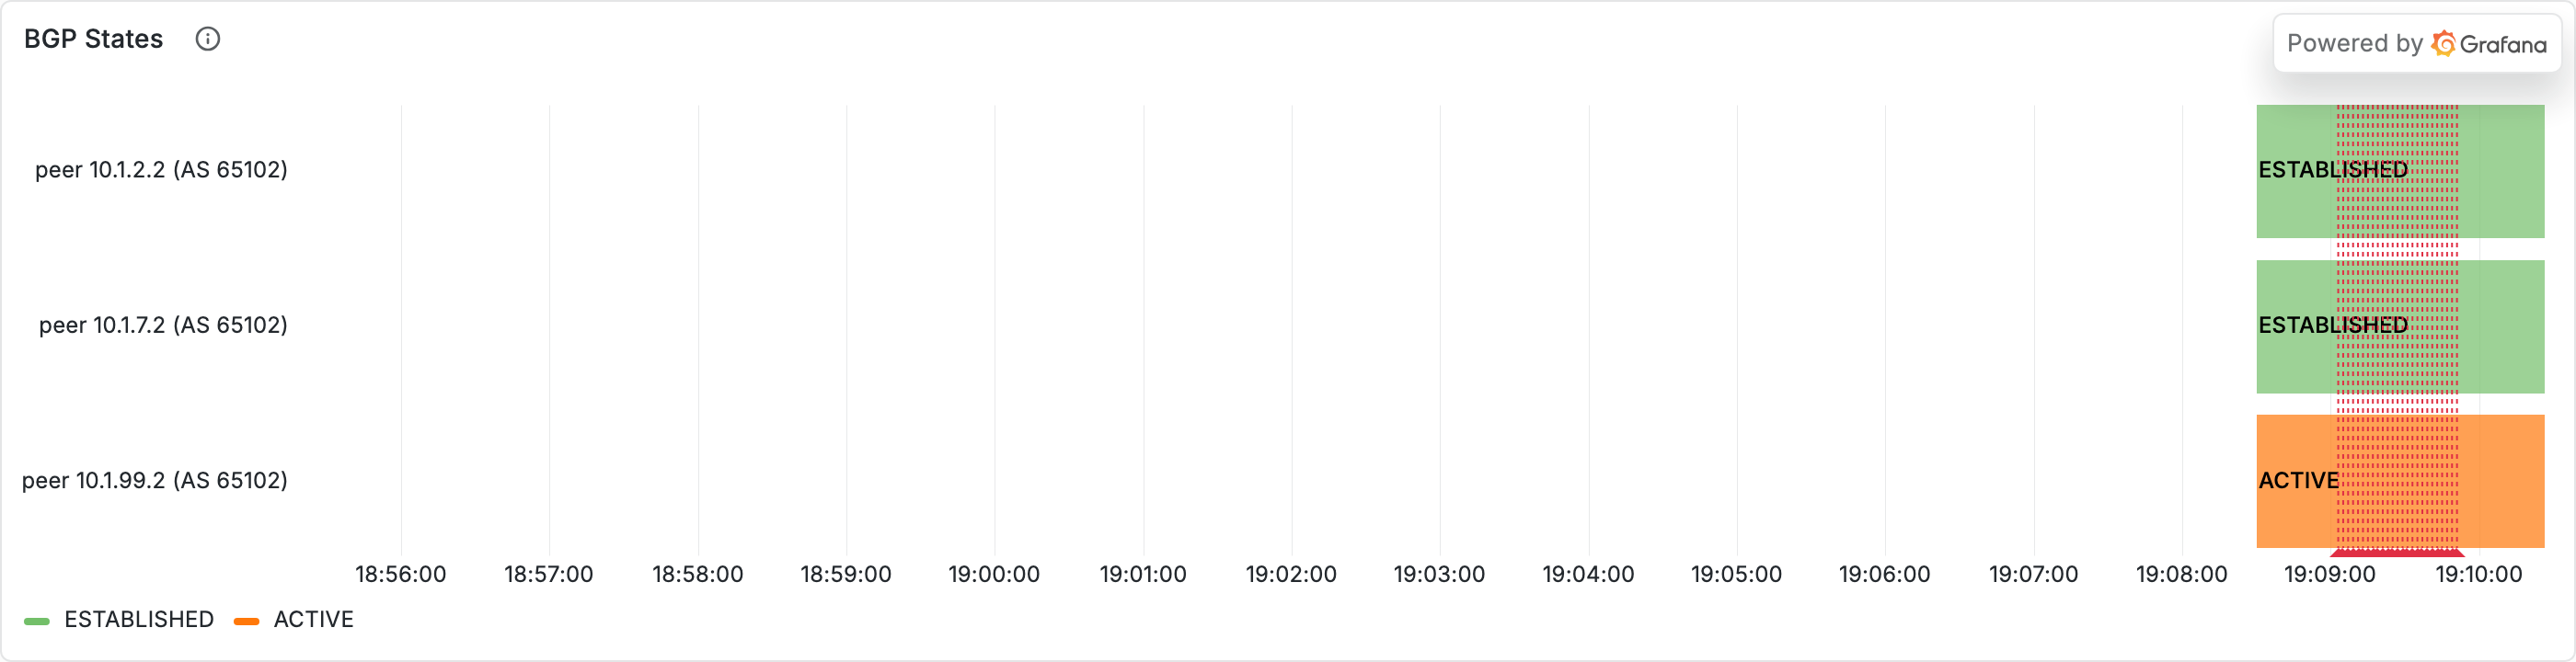
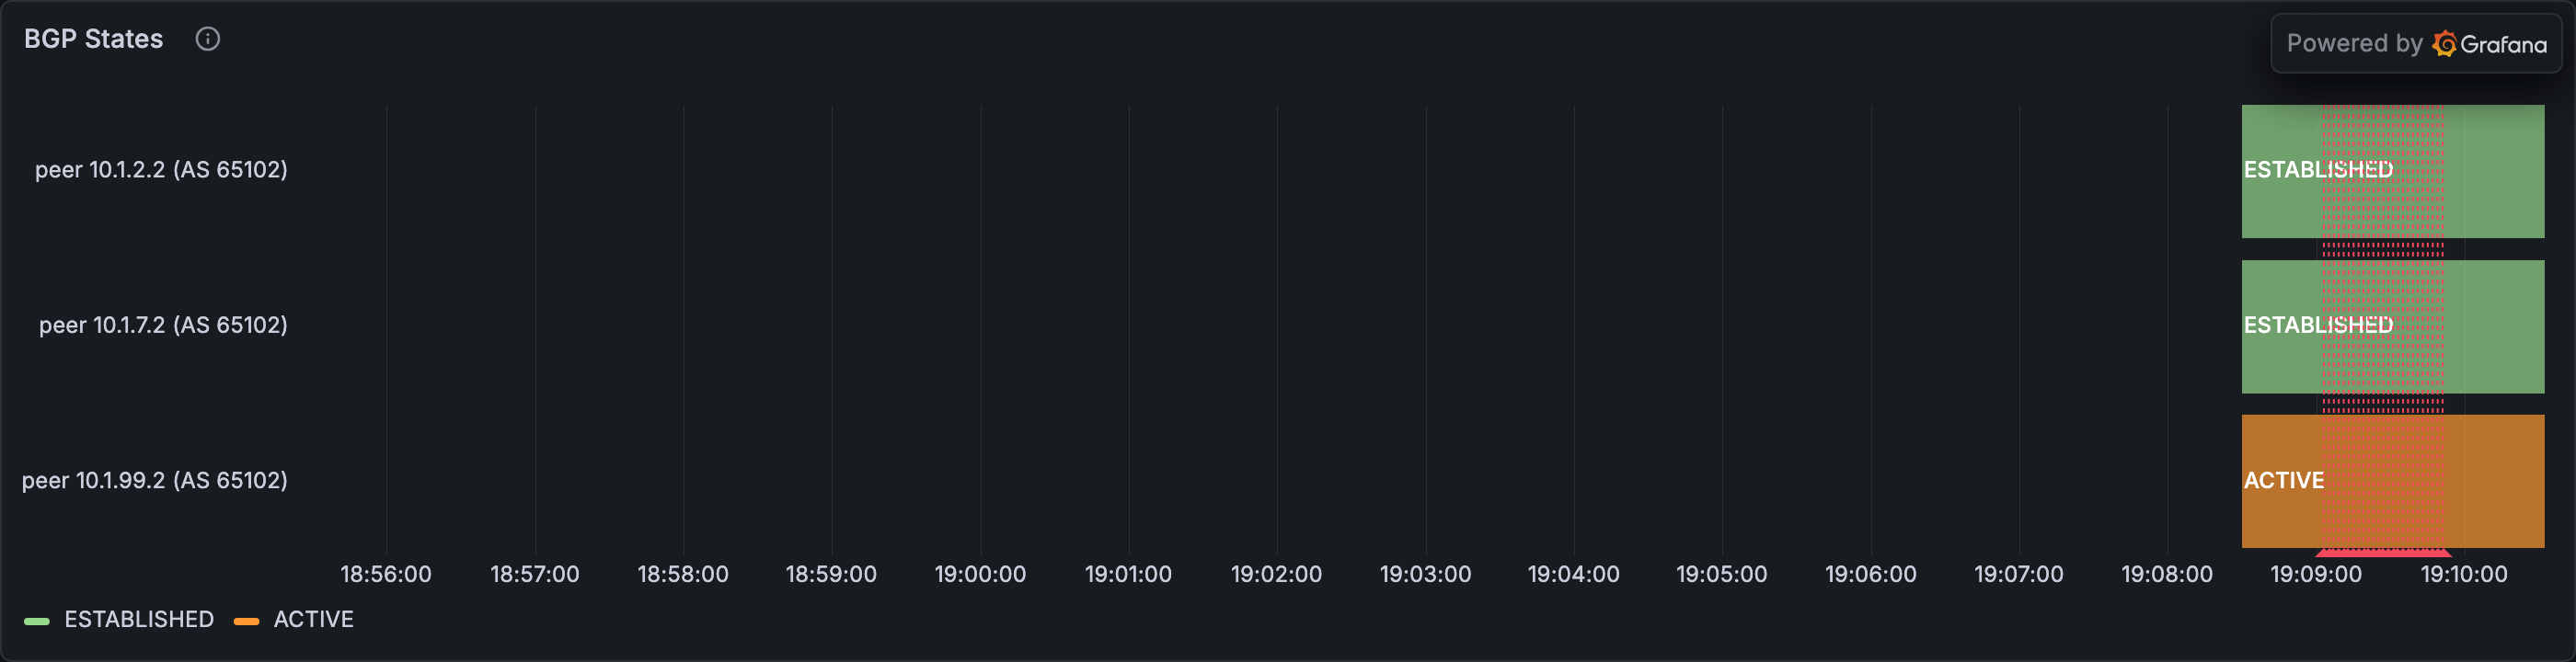
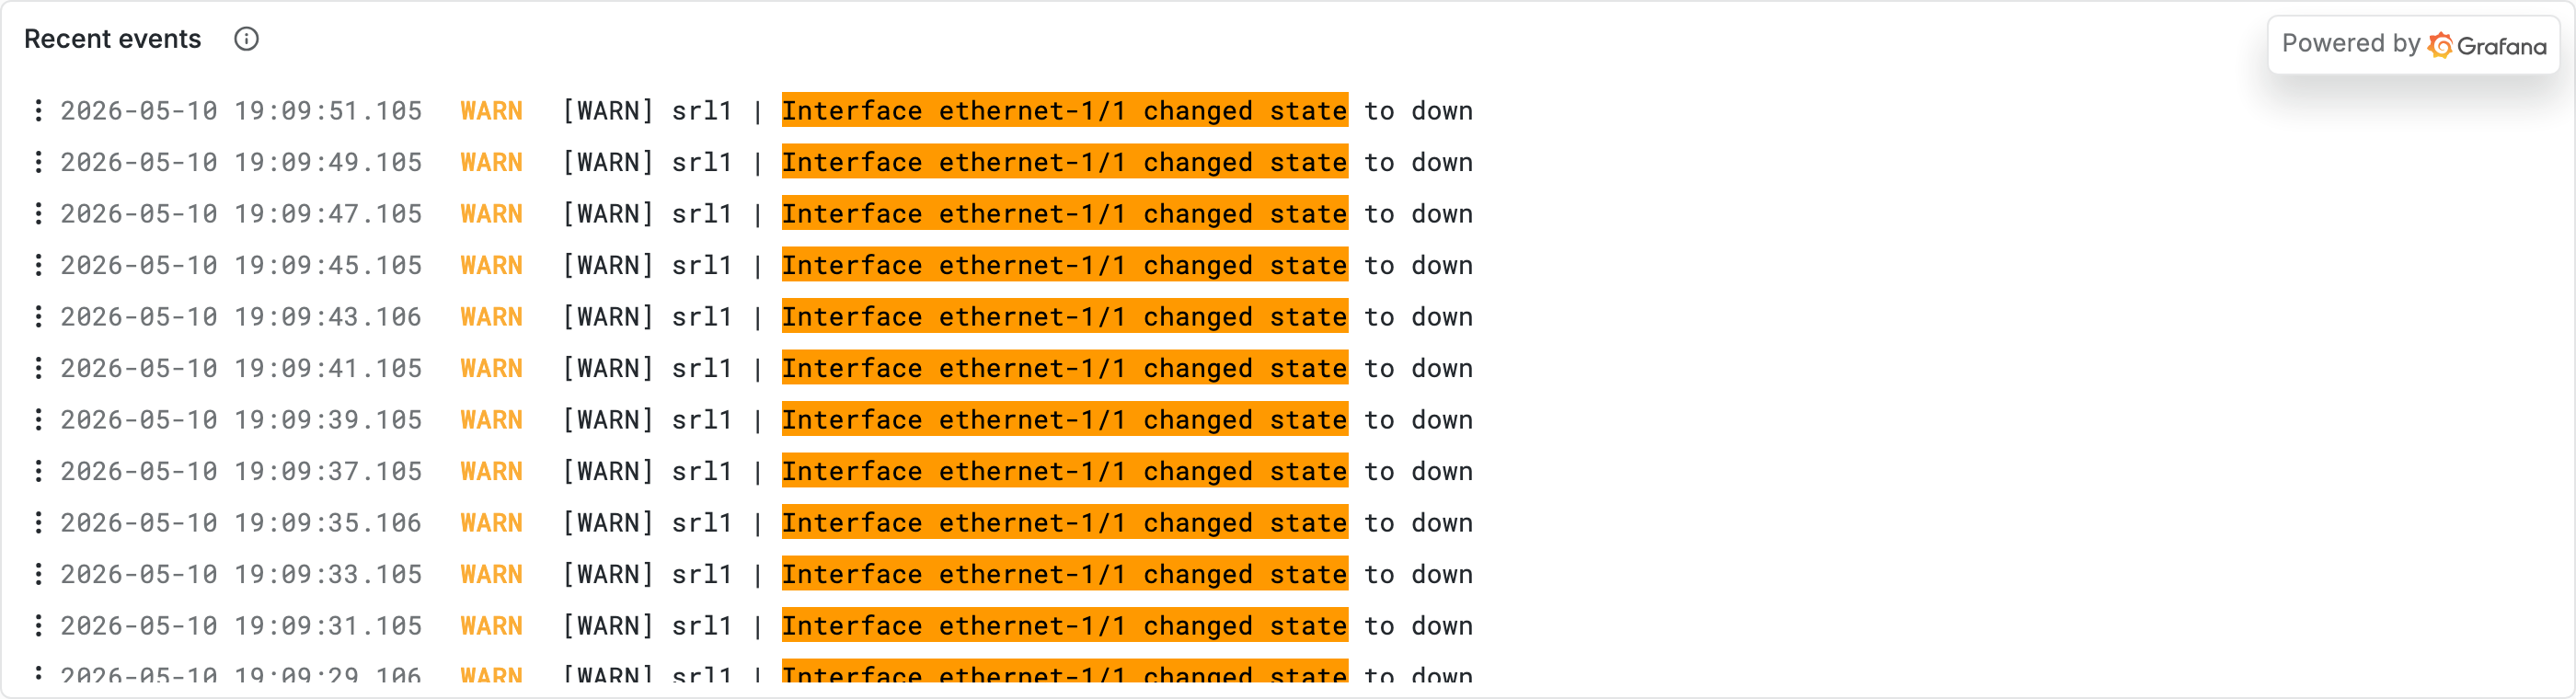
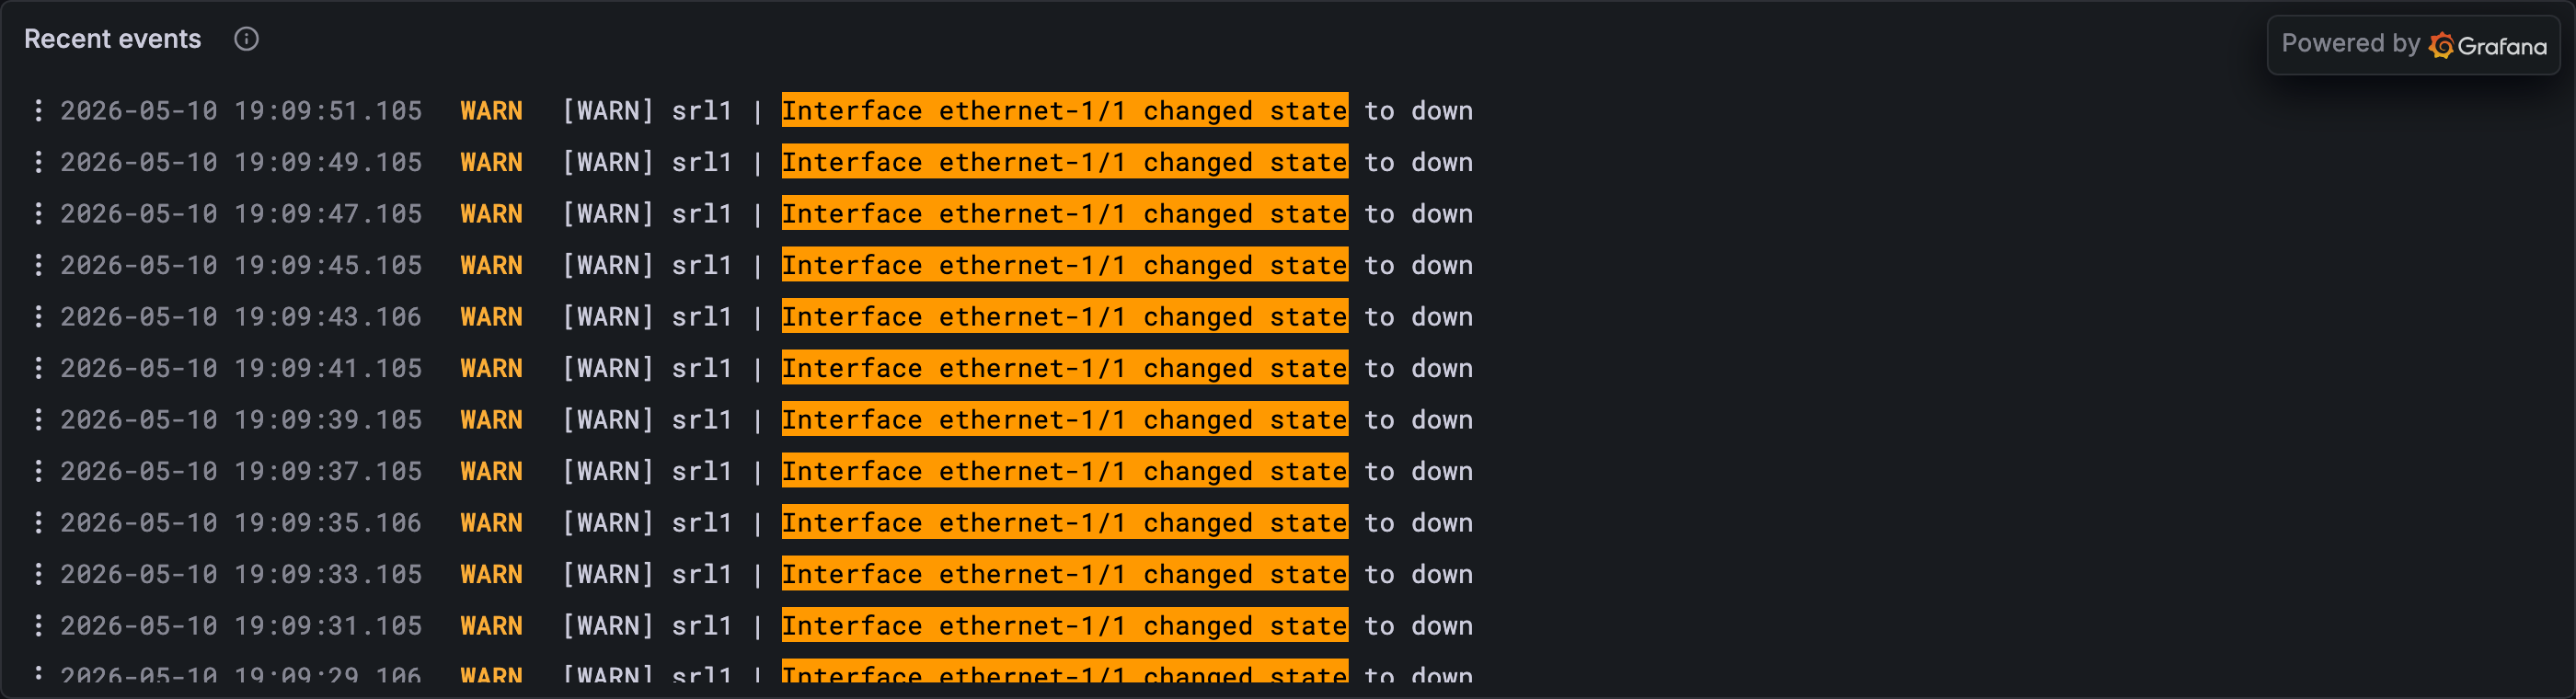
maintenance trigger lines from the CLI, and Prefect workflow annotations (decision=proceed/skip/resolved, QUARANTINE applied, AI RCA narratives). Quiet at rest; the feed lights up when you drive a flap-interface, toggle maintenance, or any Prefect flow runs.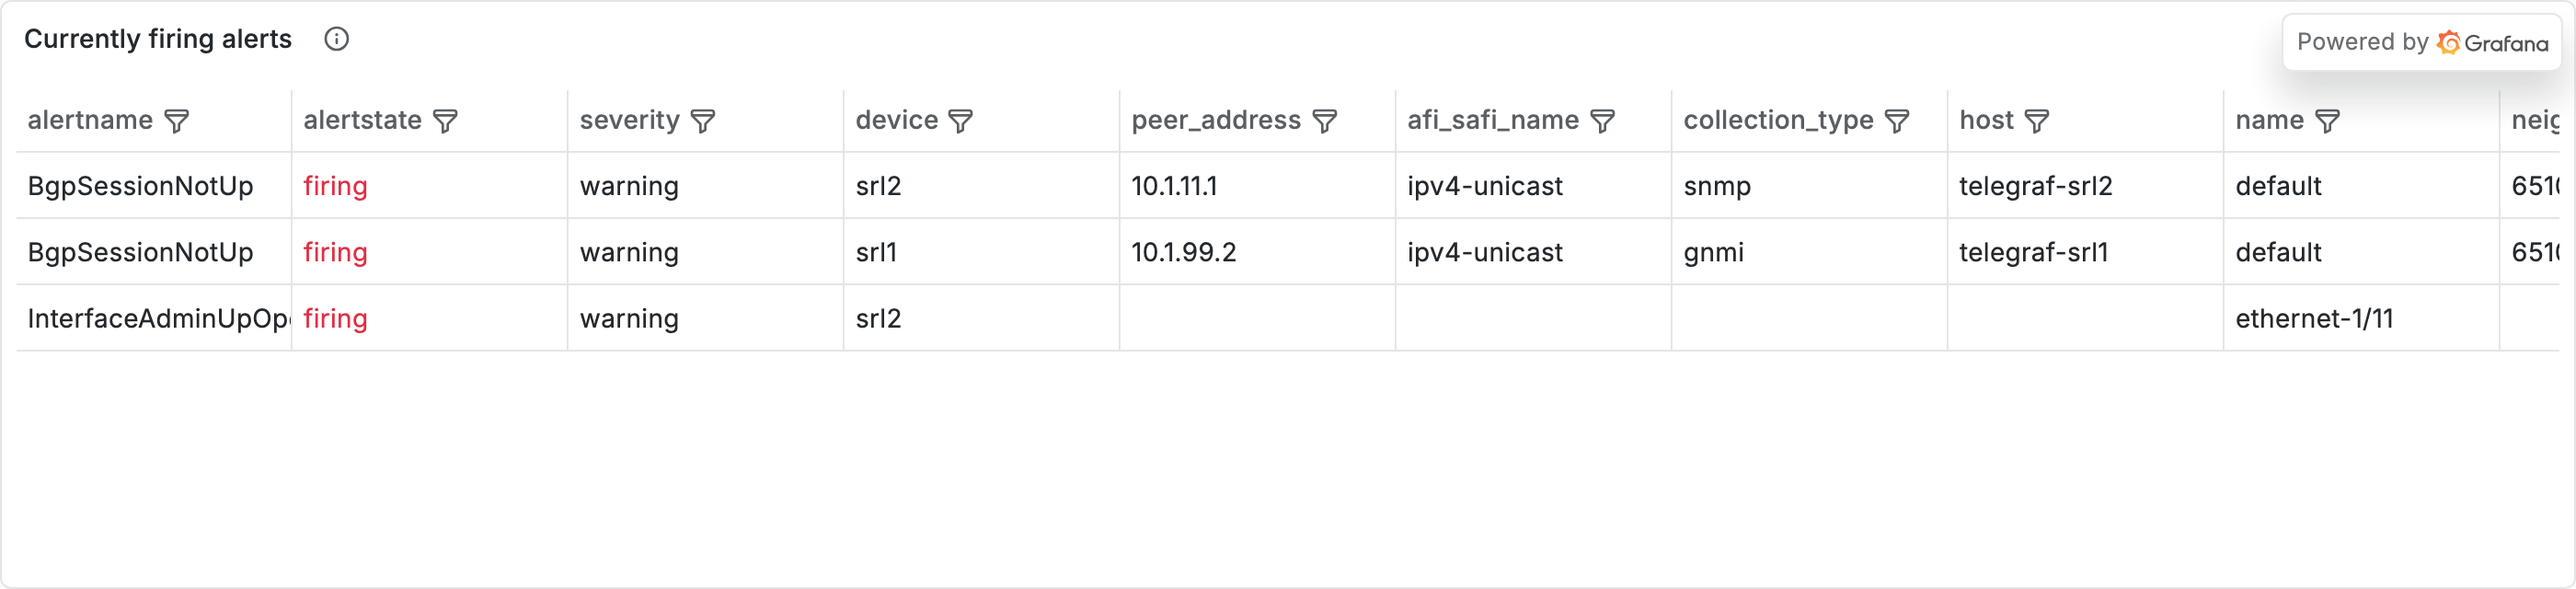
Explore mode
The compass icon in the left nav opens Explore. Pick a datasource at the top (prometheus, loki, or infrahub), type a query, pick a time range, hit Run query. This is where you'll iterate on PromQL and LogQL outside of any dashboard. Every "starter query" link on Workshop Home drops you straight into Explore with the query prefilled.
Where you'll see this in the workshop
- Part 1 — Explore mode for PromQL and LogQL practice, Workshop Home for the firing alerts feed.
- Part 2 — you live in the dashboard editor adding the flap-rate panel.
- Part 3 — Workshop Home's "Currently firing alerts" panel is your hand-off into the Prefect flow.
Going deeper
This Tour covers what you need for the workshop. For Grafana itself — panel editor internals, the time-picker, dashboard variables, transformations, plugin management — the upstream Grafana docs are the proper reference. Keep them open alongside the workshop when you build outside the exercises.
Prefect — workflows, deployments, runs
What this is
Prefect is a Python-native, event-driven workflow orchestrator. Two pieces of jargon worth unpacking up front:
A workflow orchestrator is software that takes a sequence of tasks — in Prefect's case, plain Python functions — runs them in the right order, handles retries and failures, tracks state, and gives you a UI to watch what happened after the fact. Think of it as a build system like Jenkins or GitHub Actions, but for operational automations instead of CI pipelines: the same "DAG of steps with logs and a results screen" shape, just pointed at ops work instead of "did the tests pass?".
Event-driven means the workflows don't run on a cron schedule — they fire in response to external events (a webhook, a message on a queue, a file appearing, another flow completing). That's the property that makes Prefect a natural fit for the alert → automation pipeline in this workshop: Alertmanager calls a webhook, the webhook hands the payload to Prefect, Prefect runs the deterministic flow, and every step is visible afterwards.
Why this workshop uses it
Network ops needs automation that is deterministic, auditable, and debuggable: when an alert fires, the same decision tree should run every time; an operator should be able to pull up exactly what happened on alert #847 three days later; and the per-step logs should be one click away. Prefect ships all three of those (flow runs, task graphs, per-task logs) out of the box, in Python, with a sane Docker deployment — and that's the entire reason it's here. The automation glue around Infrahub, Prometheus, and Alertmanager is already Python; Prefect runs locally on the workshop laptop without any external infra (it brings its own Postgres + Redis + server + worker compose set); and its UI is the audit trail — no separate dashboard or log-shipping glue to maintain.
Workflow orchestrators are not a one-vendor space — Airflow, Temporal, Dagster, Argo Workflows all play in adjacent corners. Prefect's sweet spot is event-driven Python automation with a usable UI, which fits the alert-handler use case better than the schedule-batch-oriented alternatives. If your team already runs one of the others, the patterns in Part 3 port across; Prefect is the implementation, not the lesson.
In this workshop, Prefect at http://localhost:4200 orchestrates the quarantine workflow that picks up alerts from the webhook. The lab runs Prefect 3 with a Postgres + Redis backend, a worker on the local-pool pool, and a flow-server container that registers the alert-receiver deployment on startup.
Further reading
For a deeper take on workflow orchestration's role in network automation architecture, see Christian Adell's Designing Network Automation at Scale — Chapter 7 (Orchestration) covers the design tradeoffs in detail. The book is published as an open online resource at https://designingnetworkautomation.com/.
The three concepts you need
| Concept | What it is | Example in the lab |
|---|---|---|
| Flow | The Python function. The code. | quarantine_bgp_flow — collect evidence, evaluate policy, decide, act, annotate. |
| Deployment | A schedulable, invokable wrapper around a flow with default parameters and a target work pool. | alert-receiver/alert-receiver — what the webhook calls when an alert lands. |
| Flow run | One execution of a deployment (or an ad-hoc flow). Has its own logs and task graph. | Every try-it run, every cascade you flap, every direct trigger. |
The four pages you'll actually use
| Page | URL | What it tells you |
|---|---|---|
| Runs | http://localhost:4200/runs | Every flow run, with state (Completed, Failed, Running), duration, parameters. |
| Deployments | http://localhost:4200/deployments | Every registered deployment. Click one to see its parameter schema and trigger an ad-hoc run. |
| Flows | http://localhost:4200/flows | Every flow the workers know about, with a count of runs and recent state distribution. |
| Automations | http://localhost:4200/automations | Triggers that fire on Prefect-side events (state changes, deployment completions). Empty in the default lab. |
Runs page — the audit trail
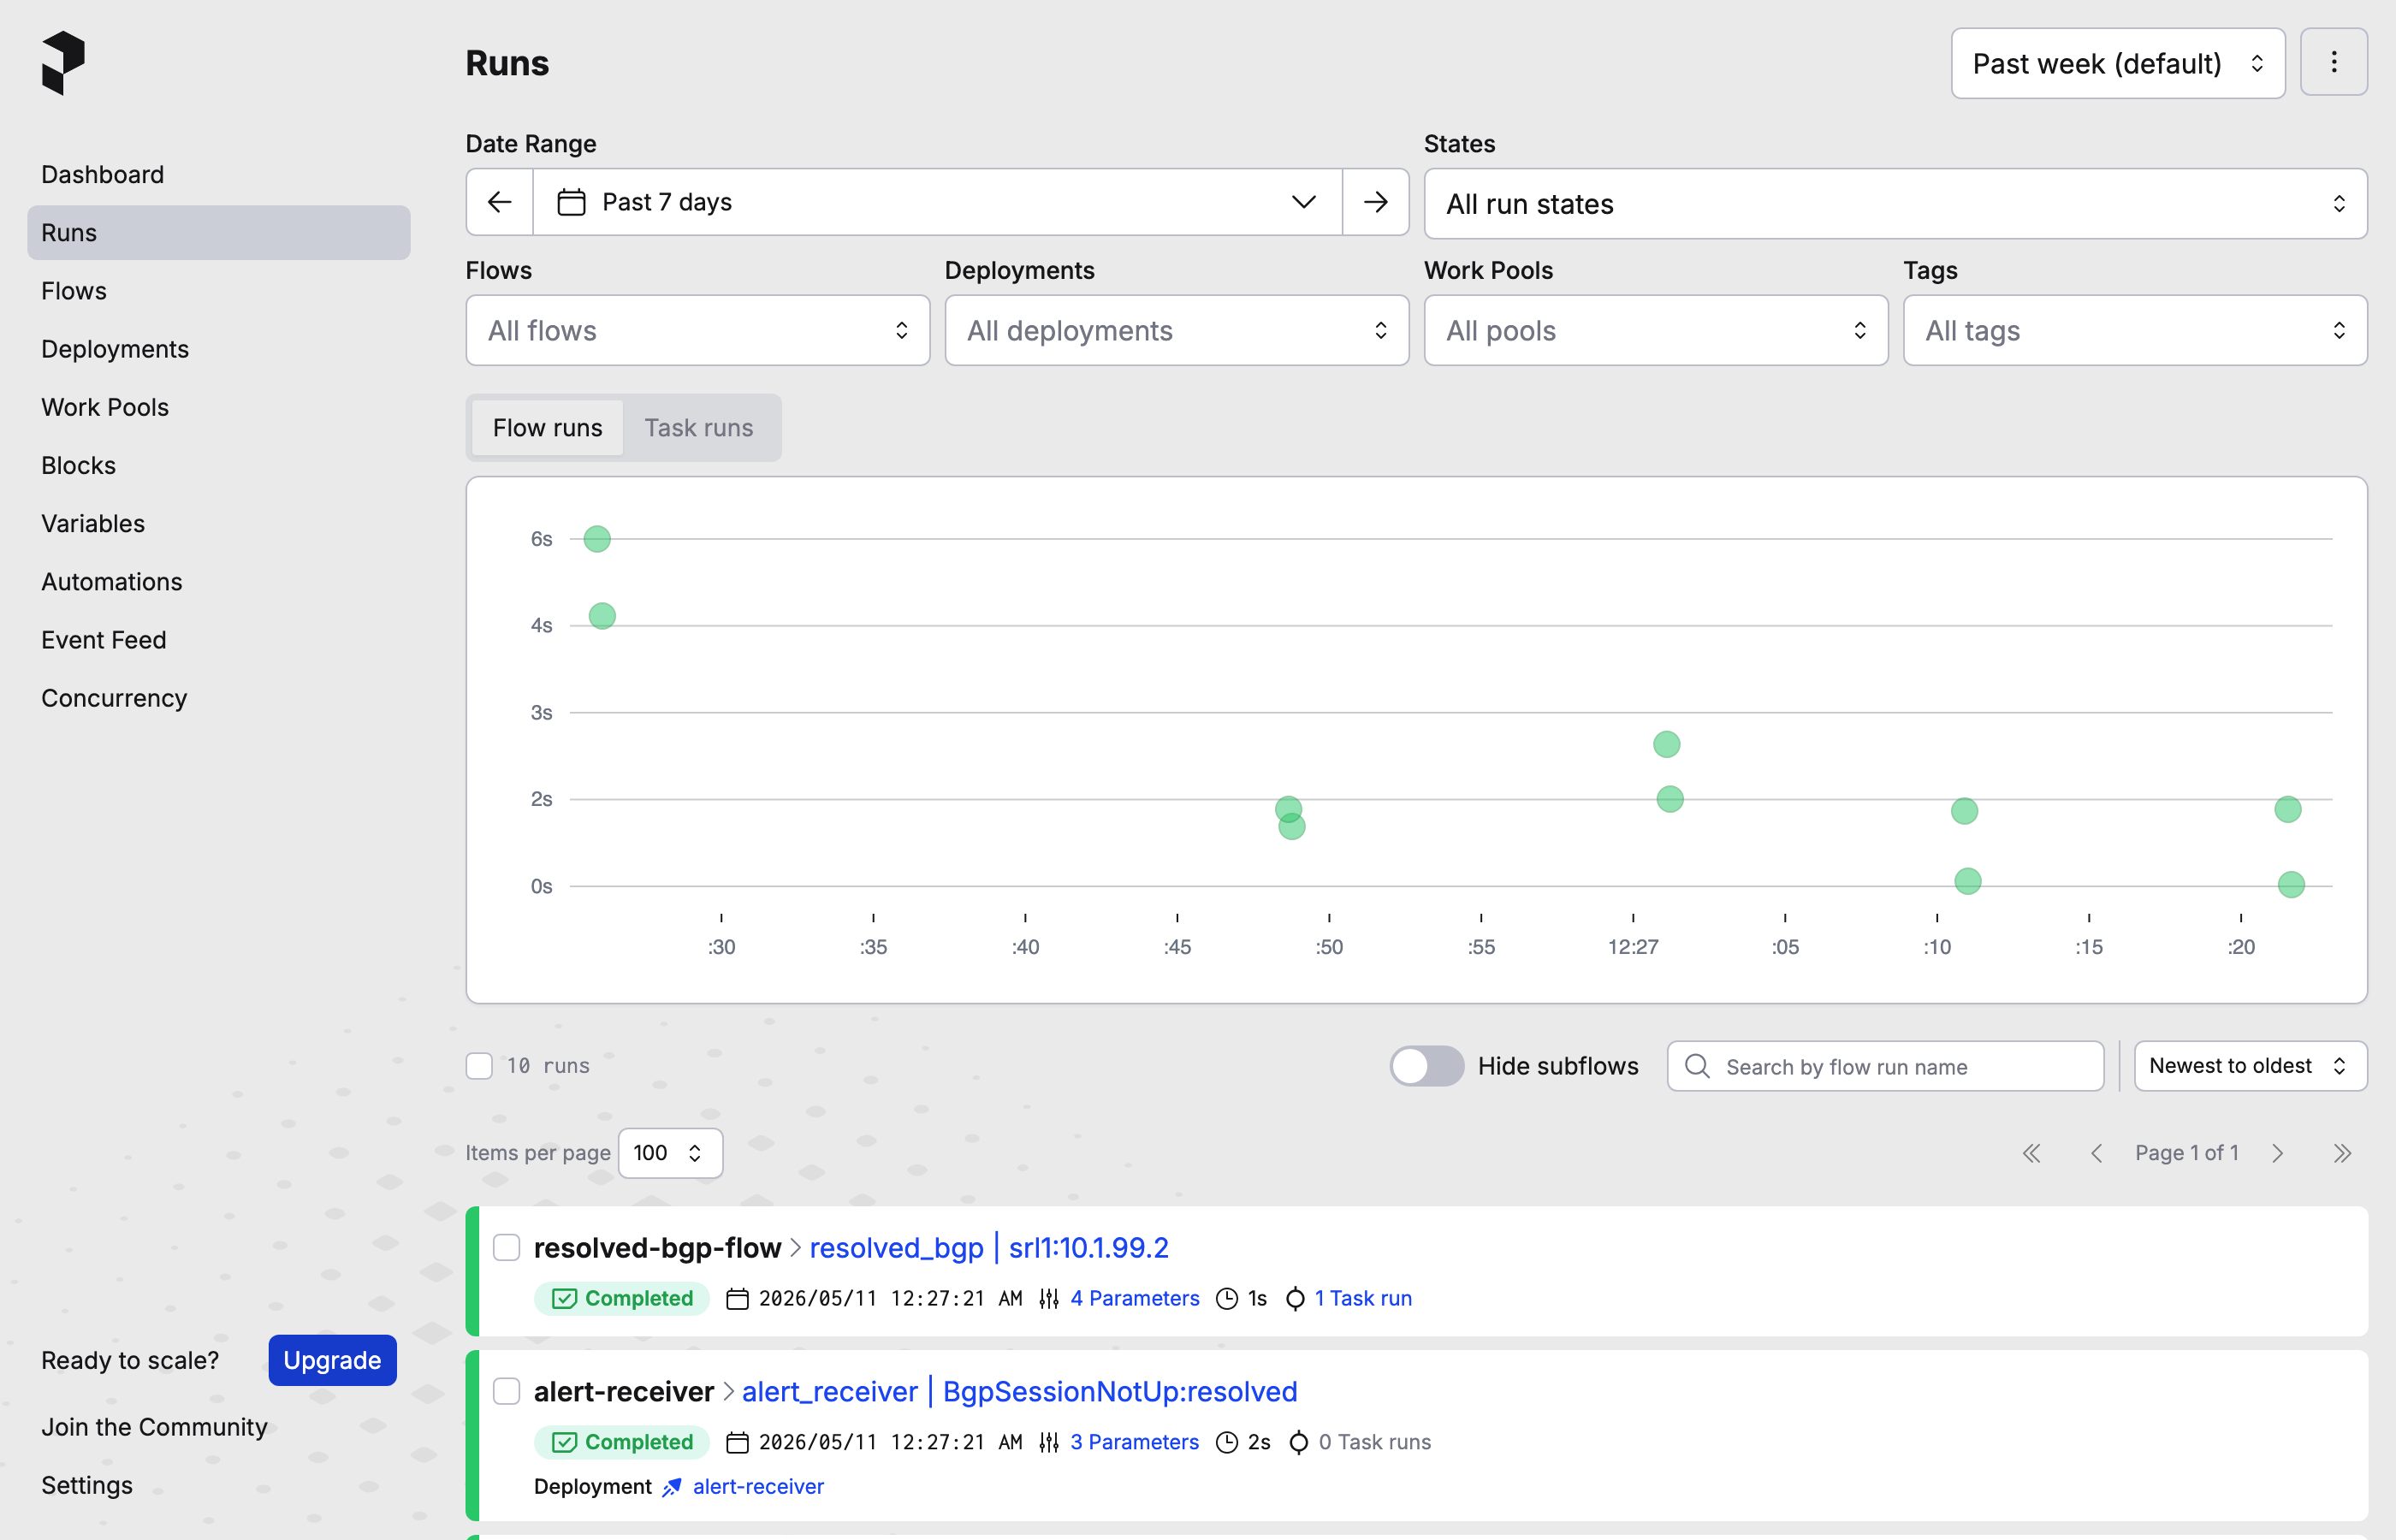
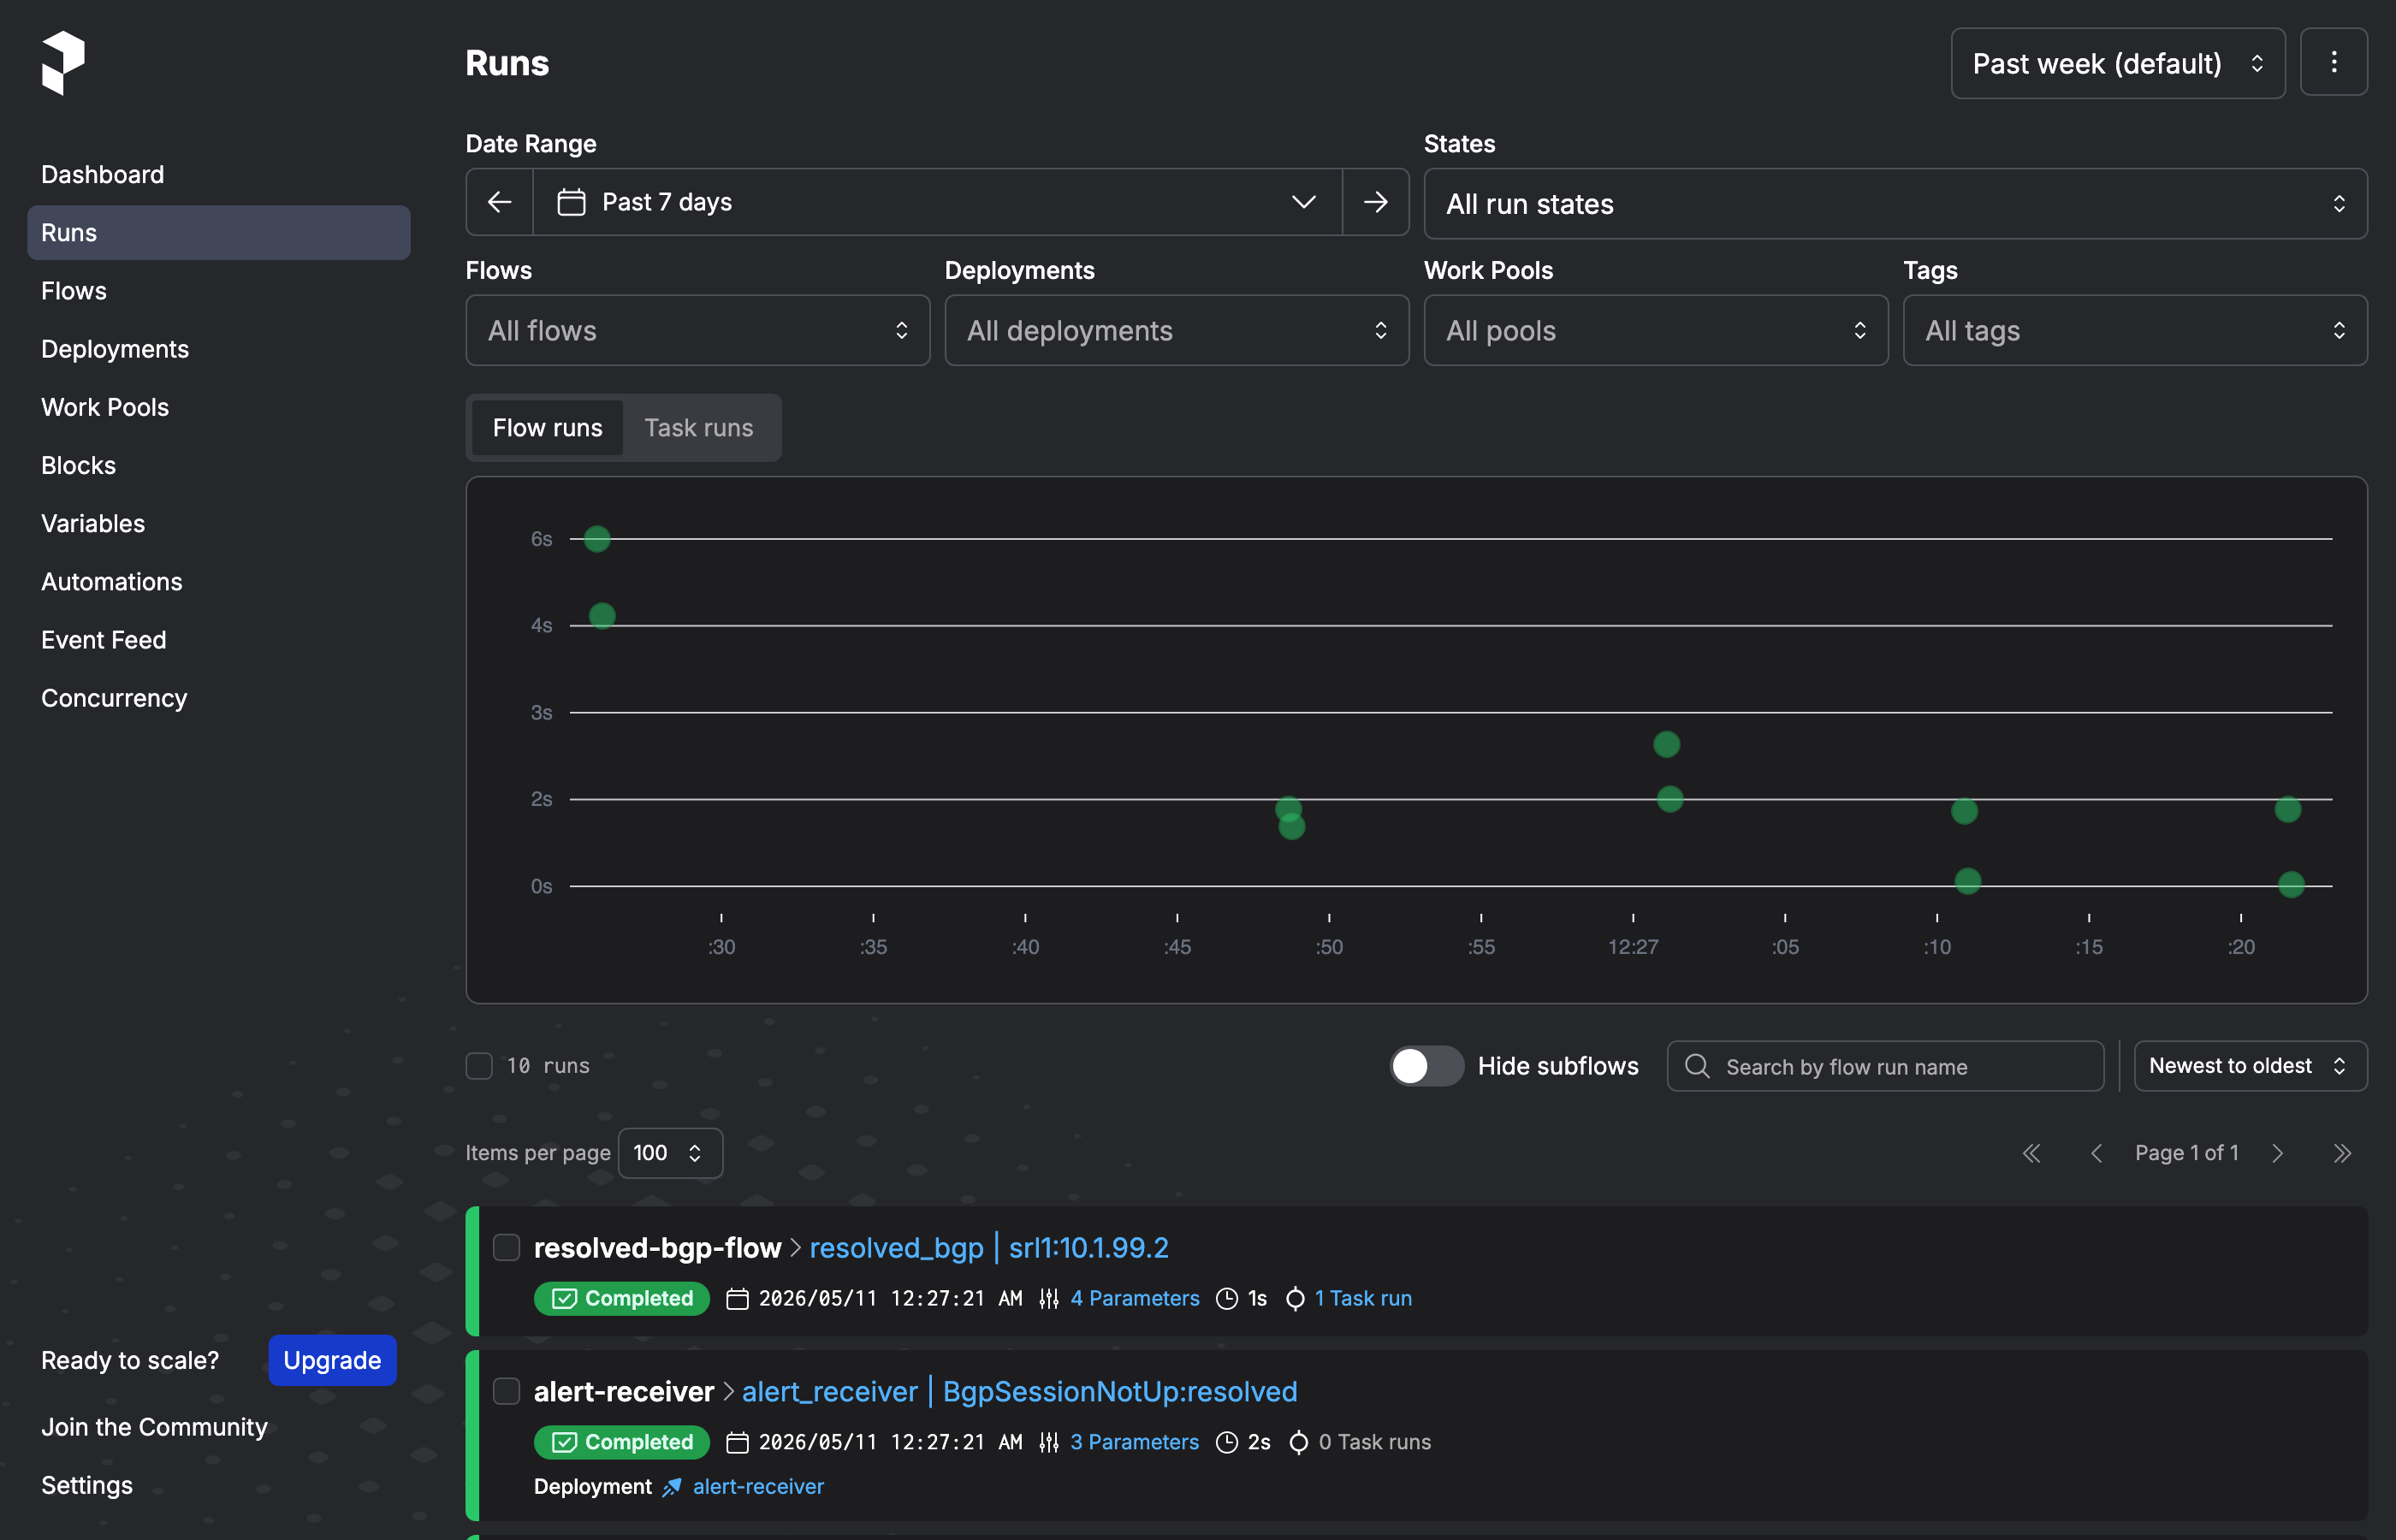
localhost:4200/runs. Every alert payload the webhook handed off shows up here as a completed flow run.Click a run to drill in. The detail page has the task graph, parameters, logs, and result.
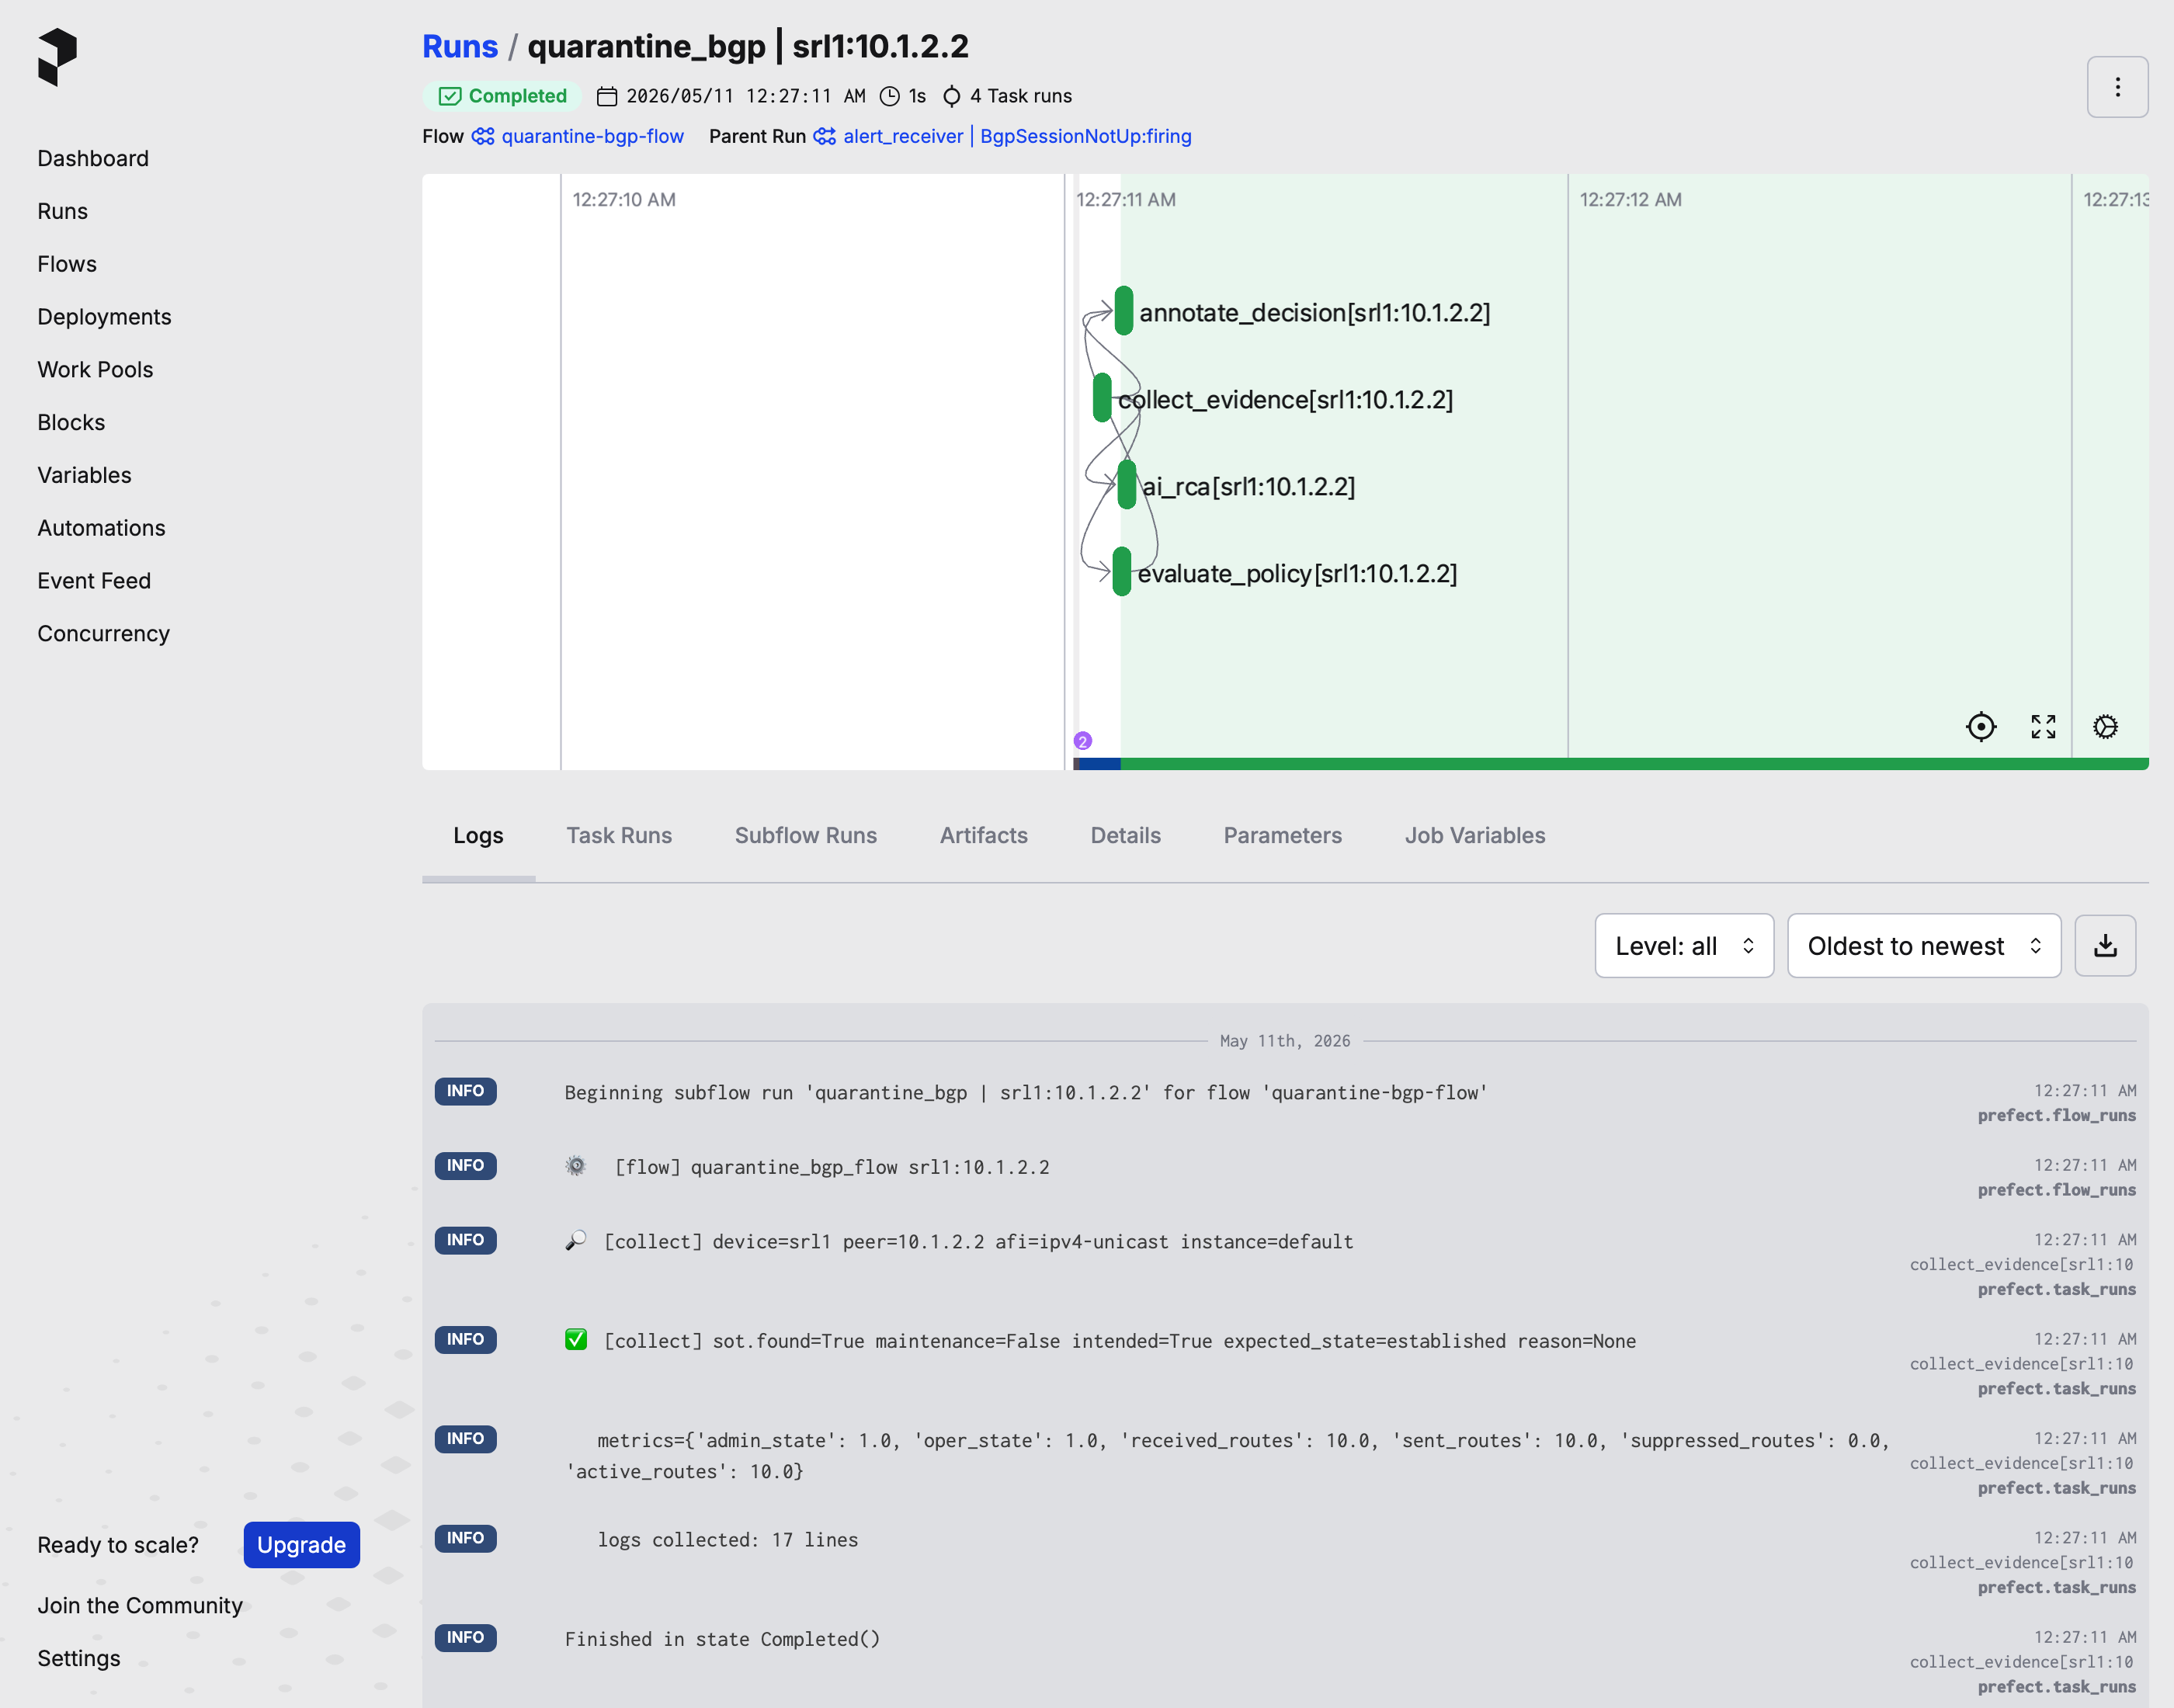
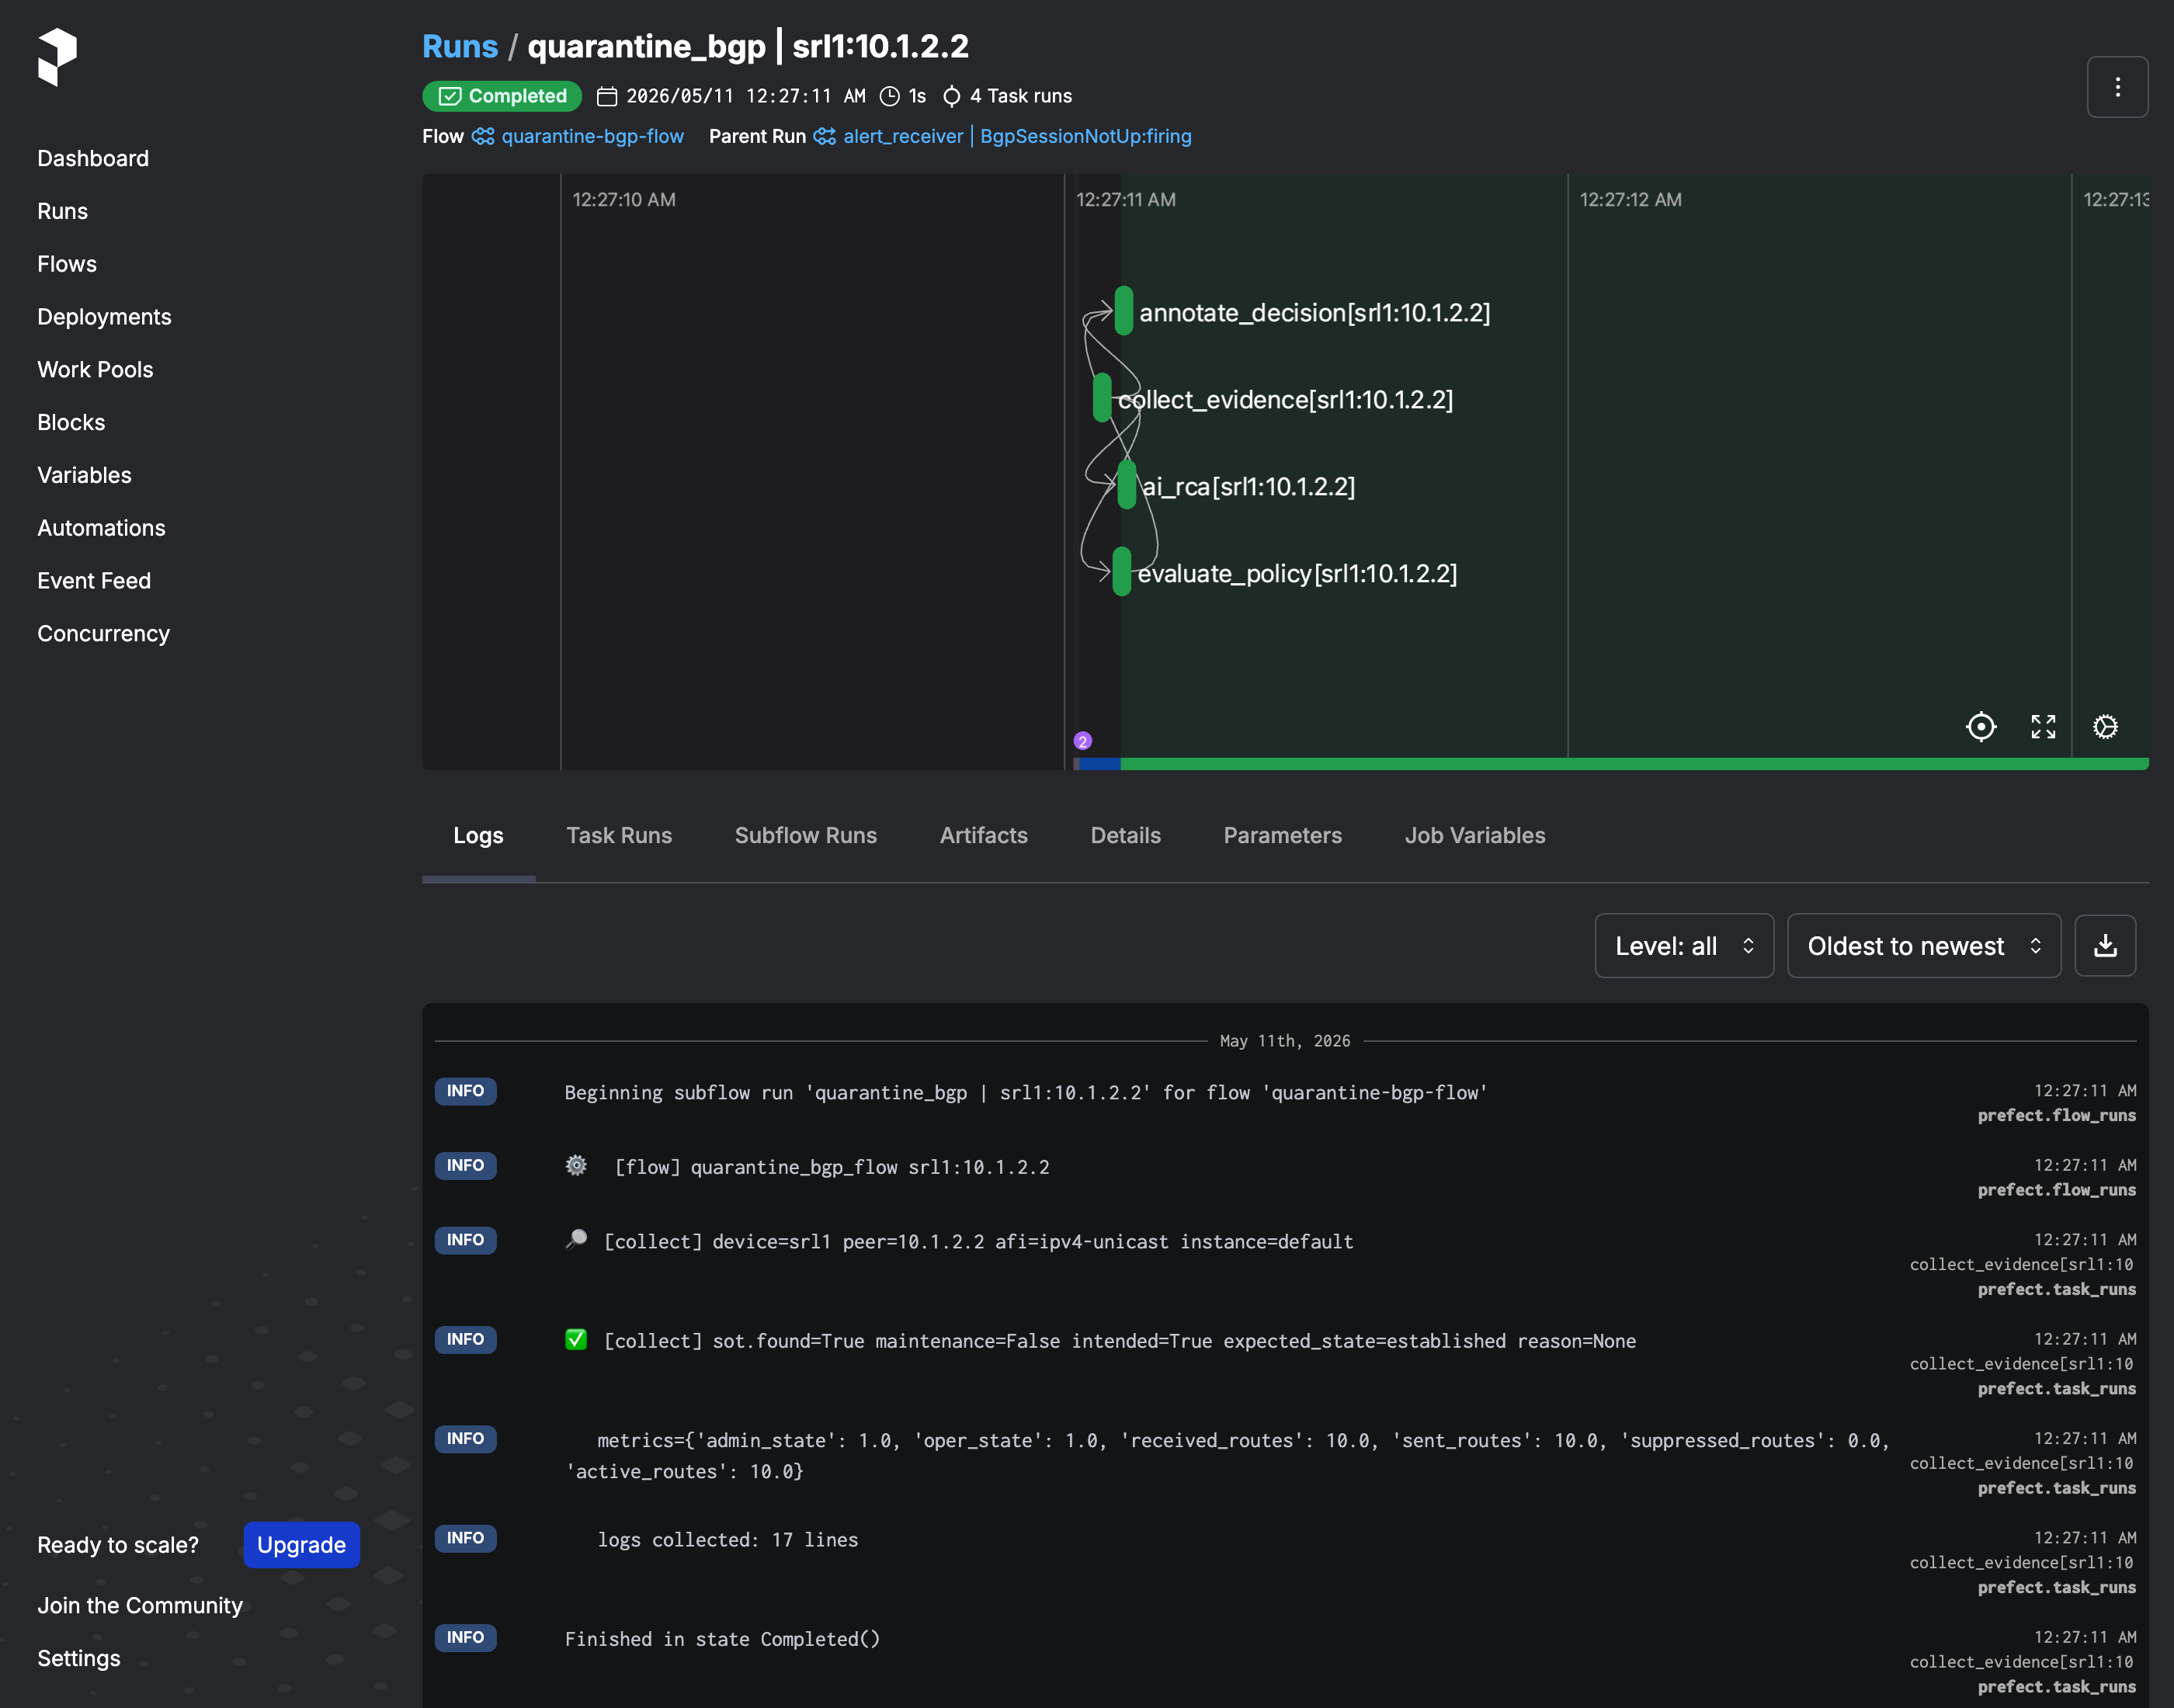
quarantine_bgp (collect_evidence → evaluate_policy → annotate_decision → ai_rca → quarantine → annotate_action) with the per-task log feed underneath.The task graph is the single best place to debug a quarantine decision — every task's output is visible, so you can see exactly what evidence the flow collected, what policy it evaluated, and which path it took. The per-task logs underneath stream live during a run.
Automations — when X happens, do Y
Prefect's Automations page (http://localhost:4200/automations) is where you wire up things that should happen after the workflow does its thing. Examples:
- Send a Slack notification every time
quarantine_bgp_flowcompletes. - Open a ticket when a flow run enters the
Failedstate. - Kick off a follow-up workflow when a deployment completes.
Every automation has the same shape: a trigger (the event to react to) and one or more actions (what to do when it fires). The Prefect 3.x form is a three-step wizard — 01 Trigger → 02 Actions → 03 Details — that builds the trigger and action list for you.
Add an automation
The fastest way to see it work: chain a follow-up workflow whenever quarantine_bgp_flow finishes a successful run.
- Open http://localhost:4200/automations and click Add Automation.
- 01 Trigger — pick Flow run state changed. Configure it to fire when the flow
quarantine-bgp-flowreaches stateCompleted, then click Next. -
02 Actions — pick Run a deployment and choose the
alert-receiverdeployment. Fill the parameter inputs:alertname:automation-firedstatus:firingalert_group: paste this JSON object as-is: Click Next.
Other action options exist — Send a notification for example — but those need a "notification block" (a stored credential bundle for Slack, Discord, PagerDuty, etc.) configured first. None are pre-configured in this lab. Skip unless you have a target system ready to wire up.
-
03 Details — name it
chain-after-quarantineand click Save.
Watch it fire
Drive any path — for example, nobs autocon5 try-it --auto. Then refresh http://localhost:4200/runs. Each quarantine_bgp_flow completion now fires the automation, which kicks off a fresh alert-receiver flow run alongside the original. The two are visible as separate rows in the runs list.
What an automation looks like in storage
Behind the UI form, Prefect stores the automation as a structured record — trigger + actions — that the API can list, create, or delete. After saving the example above, this query returns the record:
curl -s -X POST 'http://localhost:4200/api/automations/filter' \
  -H 'content-type: application/json' -d '{"limit": 10}' | jq '.[] | {name, enabled, trigger, actions}'
{
  "name": "chain-after-quarantine",
  "description": "Demo: fire alert-receiver when quarantine_bgp_flow completes",
  "enabled": true,
  "trigger": {
    "type": "event",
    "match": {"prefect.resource.id": "prefect.flow-run.*"},
    "match_related": {
      "prefect.resource.id": "prefect.flow.<quarantine_bgp_flow_id>",
      "prefect.resource.role": "flow"
    },
    "expect": ["prefect.flow-run.Completed"],
    "for_each": ["prefect.resource.id"],
    "posture": "Reactive",
    "threshold": 1
  },
  "actions": [{
    "type": "run-deployment",
    "deployment_id": "<alert-receiver-deployment-id>",
    "parameters": {
      "alertname": "automation-fired",
      "status": "firing"
    }
  }]
}
posture: "Reactive" means fire-on-event (as opposed to "Proactive" which fires on absence-of-event). The actions array is what the "Action" panel writes — run-deployment here, but the same array can hold notification or webhook actions. This whole record can be exported, edited, and POST'd back to the API — same shape as a Terraform resource for an automation, if your team works that way.
The pattern — stackable triggers
Automations let you stack reactive layers on top of the alert pipeline:
- Layer 1 (the alert pipeline you walk in Part 3): Alertmanager fires → webhook →
quarantine_bgp_flow→ silence + audit record. - Layer 2 (an automation):
quarantine_bgp_flowcompleted → automation matched → notification / follow-up / ticket. - Layer 3+: a Layer 2 action's completion can fire another automation, and so on.
Each layer narrows the trigger and adds context for the next. In a real incident-response platform this is how event chains compose — same shape, different transports.
   ALERT PIPELINE                       AUTOMATION LAYER
   ──────────────                       ────────────────

   Alertmanager                         Prefect Automation
   fires alert                          (configured in UI)
        │                                    │
        │  TRIGGER                           │  TRIGGER
        ▼                                    ▼
   Webhook receives                     Flow run state changed
   BgpSessionNotUp payload              (quarantine_bgp_flow
        │                                → Completed)
        │  MATCH                            │
        ▼                                   │  MATCH
   quarantine_bgp_flow                      ▼
   (DecisionPolicy)                     Automation criteria met
        │                                    │
        │  ACTION                            │  ACTION
        ▼                                    ▼
   silence + audit record               Send notification
                                        or Run deployment
                                        or webhook out
Layer 1 reacts to alerts. Layer 2 reacts to Layer 1's completions. Stackable indefinitely.
Where you'll see this in the workshop
- Part 3 spends most of its time in here. You'll trigger four canonical paths from
try-it, then watch each one render as a flow run. - Advanced — you reason about Prefect runs as your audit trail when you write the final incident runbook.
Infrahub — source of truth
What this is
Infrahub is a source of truth (sometimes called an intent store) for network infrastructure — a database that stores what should be true about your network: which devices exist, what their roles are, which BGP sessions are supposed to be up, who they're peering with, whether a device is currently in maintenance. If you've used NetBox or Nautobot as a DCIM, you already know the genre — Infrahub plays in the same space, with a richer schema engine and built-in branching (you can propose a config change on a branch, diff it, and merge it, like Git for infrastructure data).
The reason intent matters in alerting is simple: a bare alert says "this BGP session is down", but the right question to ask is "was this session supposed to be up?" — and the only place that knows is the source of truth. A peer in scheduled maintenance, a session that was decommissioned last week, a peer that's intentionally left configured but down for testing — all three look identical in metrics, but the correct response to each is different. Pulling intent into the alert pipeline is what turns a noisy alert into a real incident decision.
In this workshop, Infrahub at http://localhost:8000 (login admin / infrahub) stores intent — device roles, expected BGP sessions, maintenance windows — that the Prefect flow consults before deciding what to do with an alert.
What's loaded
nobs autocon5 load-infrahub (which you ran during setup) applies the workshop schema and seeds two WorkshopDevice records (srl1, srl2), each with their BgpSession relationships. The schema fields the policy reads:
name,asn,role,site_name— basic identity.maintenance— boolean. Iftrue, the flow skips quarantine.bgp_sessions(relationship) — each withpeer_address,afi_safi,expected_state,remote_as,expected_prefixes_received,reason.
The three places you'll actually use
| Where | URL | What it tells you |
|---|---|---|
| Network Device list | http://localhost:8000/objects/WorkshopDevice | Browse srl1 and srl2, click into the per-device attribute view. ("Network Device" is the UI label; WorkshopDevice is the underlying schema name, which is what the URL uses.) |
| GraphQL Sandbox | http://localhost:8000/graphql | Run the exact query the Prefect flow runs. Edit it, see what changes. |
| Branch indicator | top-right of every page | Infrahub is branch-aware. main is the live branch the flow reads. |
WorkshopDevice detail
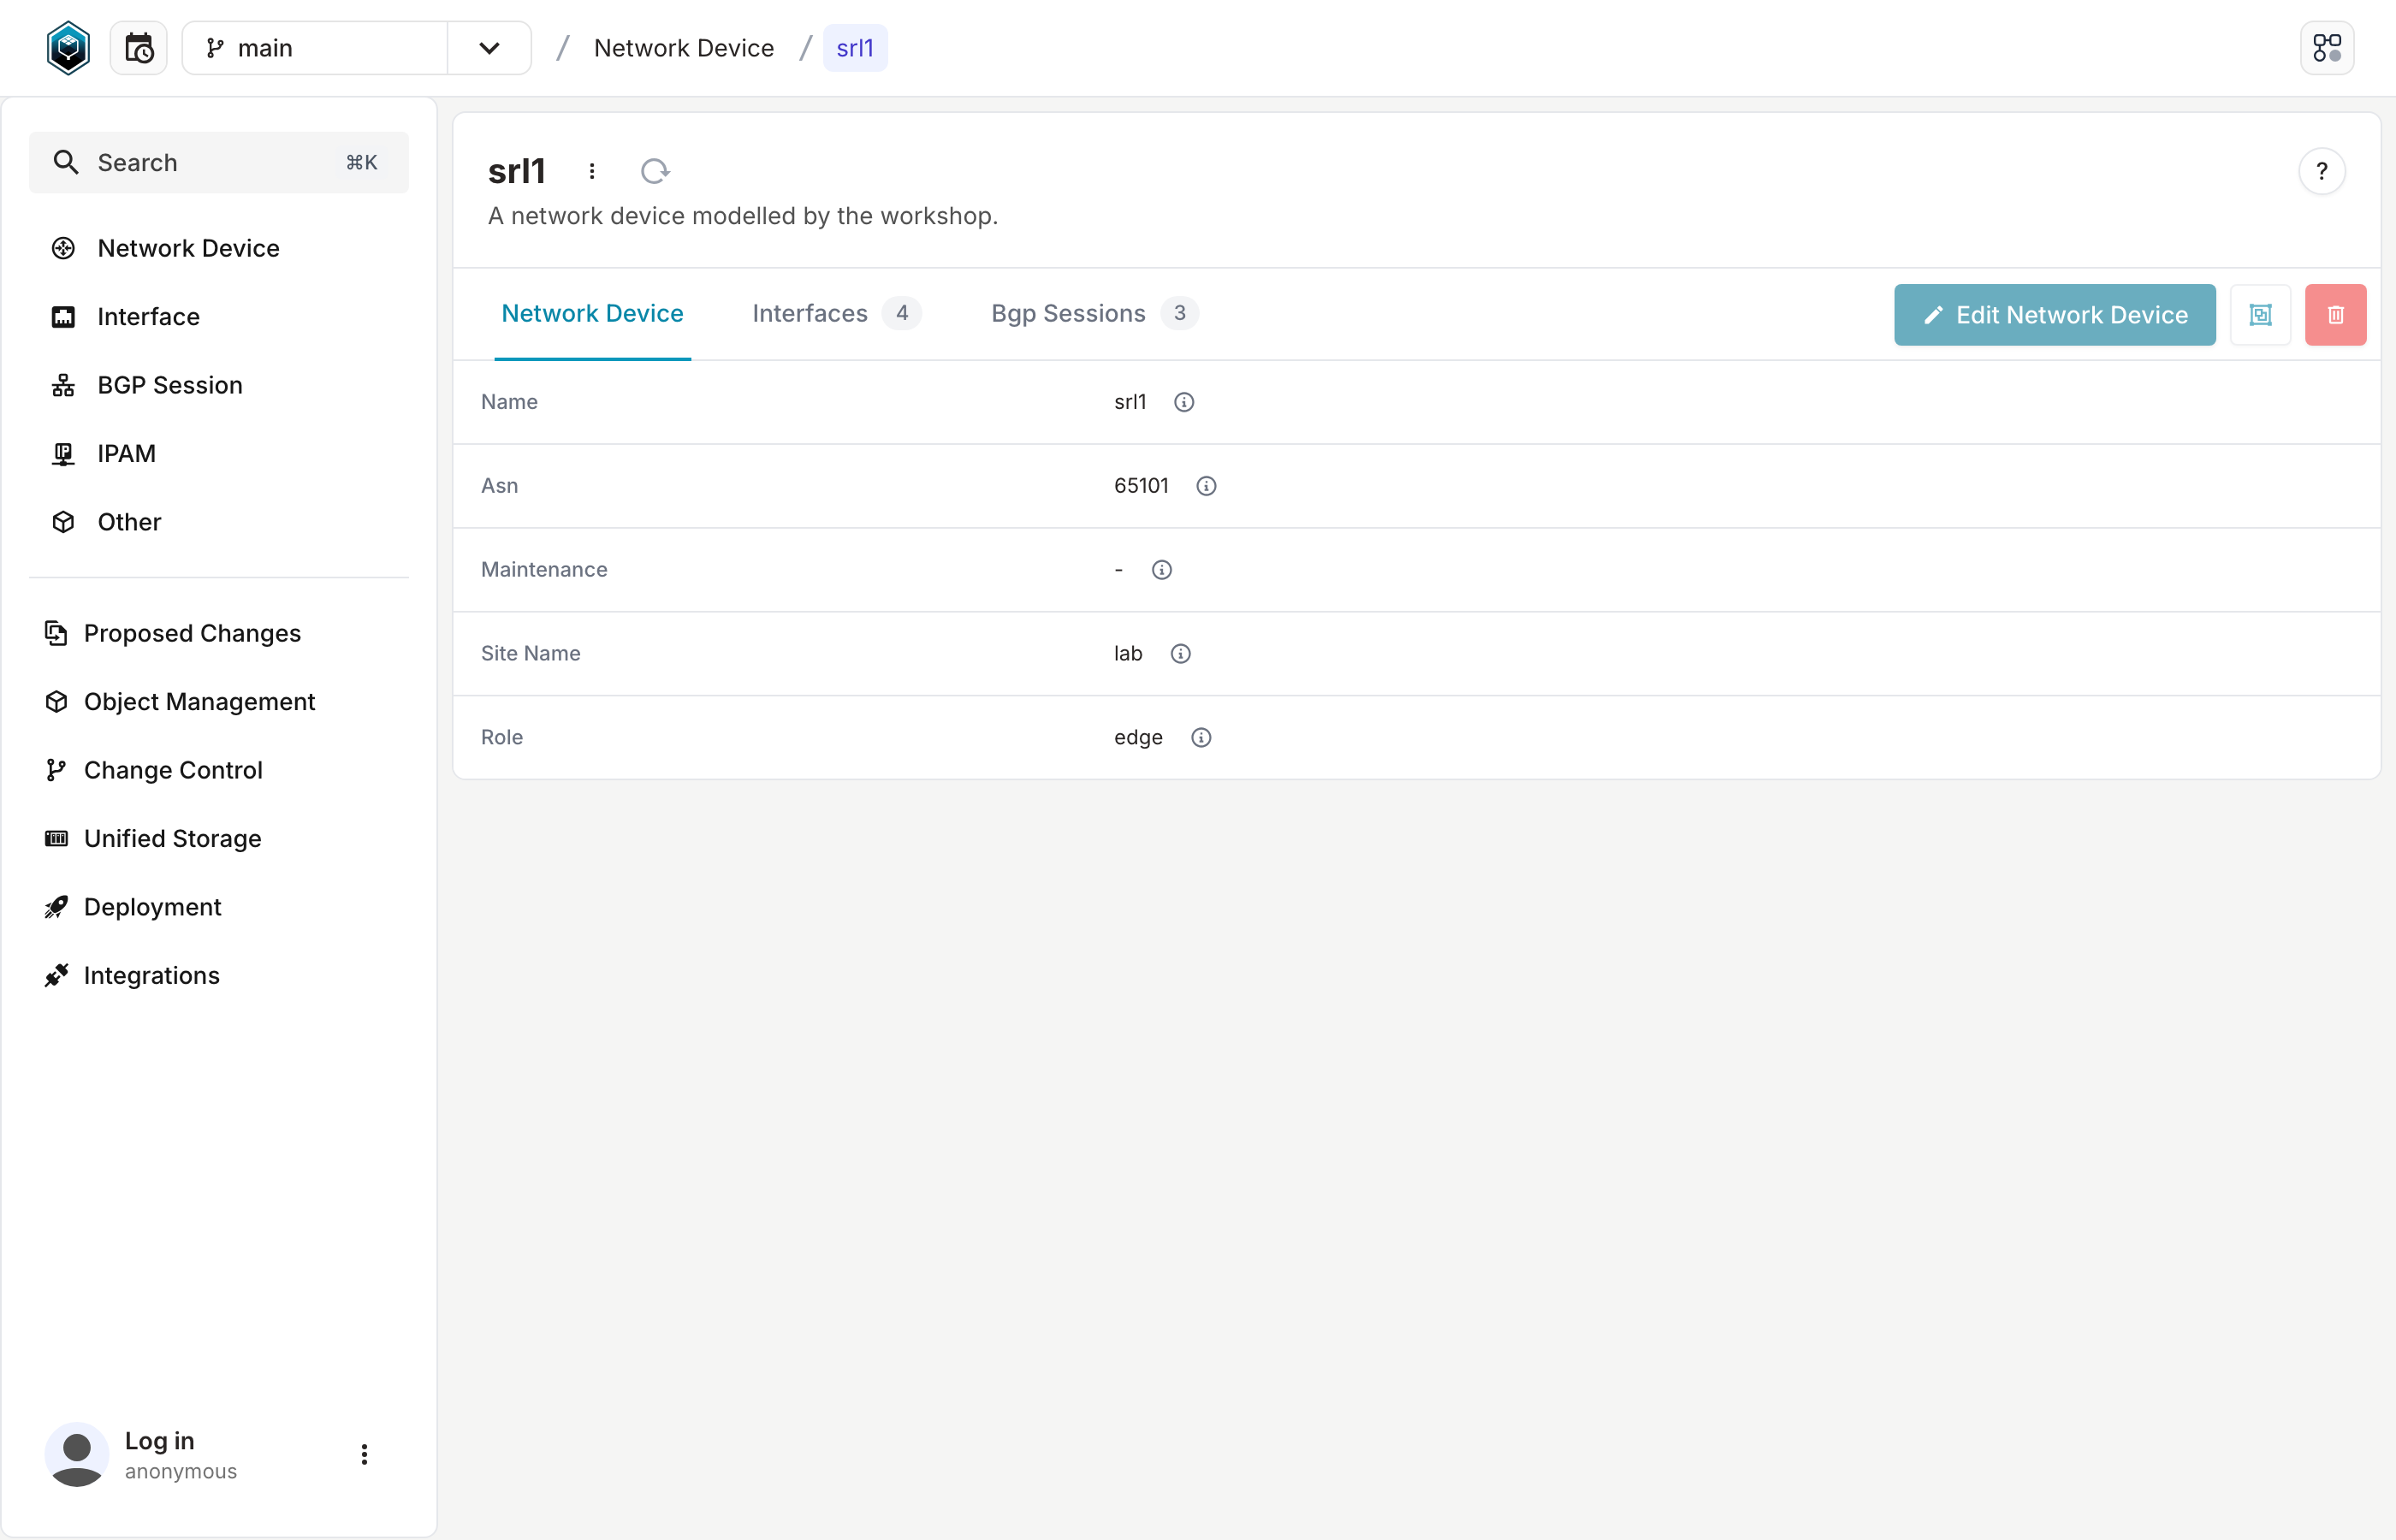
WorkshopDevice/srl1 · the intent the flow consults: ASN, Maintenance, Site Name, Role, plus Interfaces and BGP Sessions on the tabs above. Toggle Maintenance here and the next alert for this device is skipped by the policy.Click Network Device in Infrahub's left nav (that's the UI label for the schema — the underlying GraphQL type is still WorkshopDevice), then click srl1. Open the Bgp Sessions tab on the device detail and click a row (e.g., 10.1.99.2) — you'll see Expected State = Established, Reason = ip-mismatch-demo. That's the per-peer intent the flow's policy compares against the live bgp_oper_state metric in Prometheus.
GraphQL Sandbox
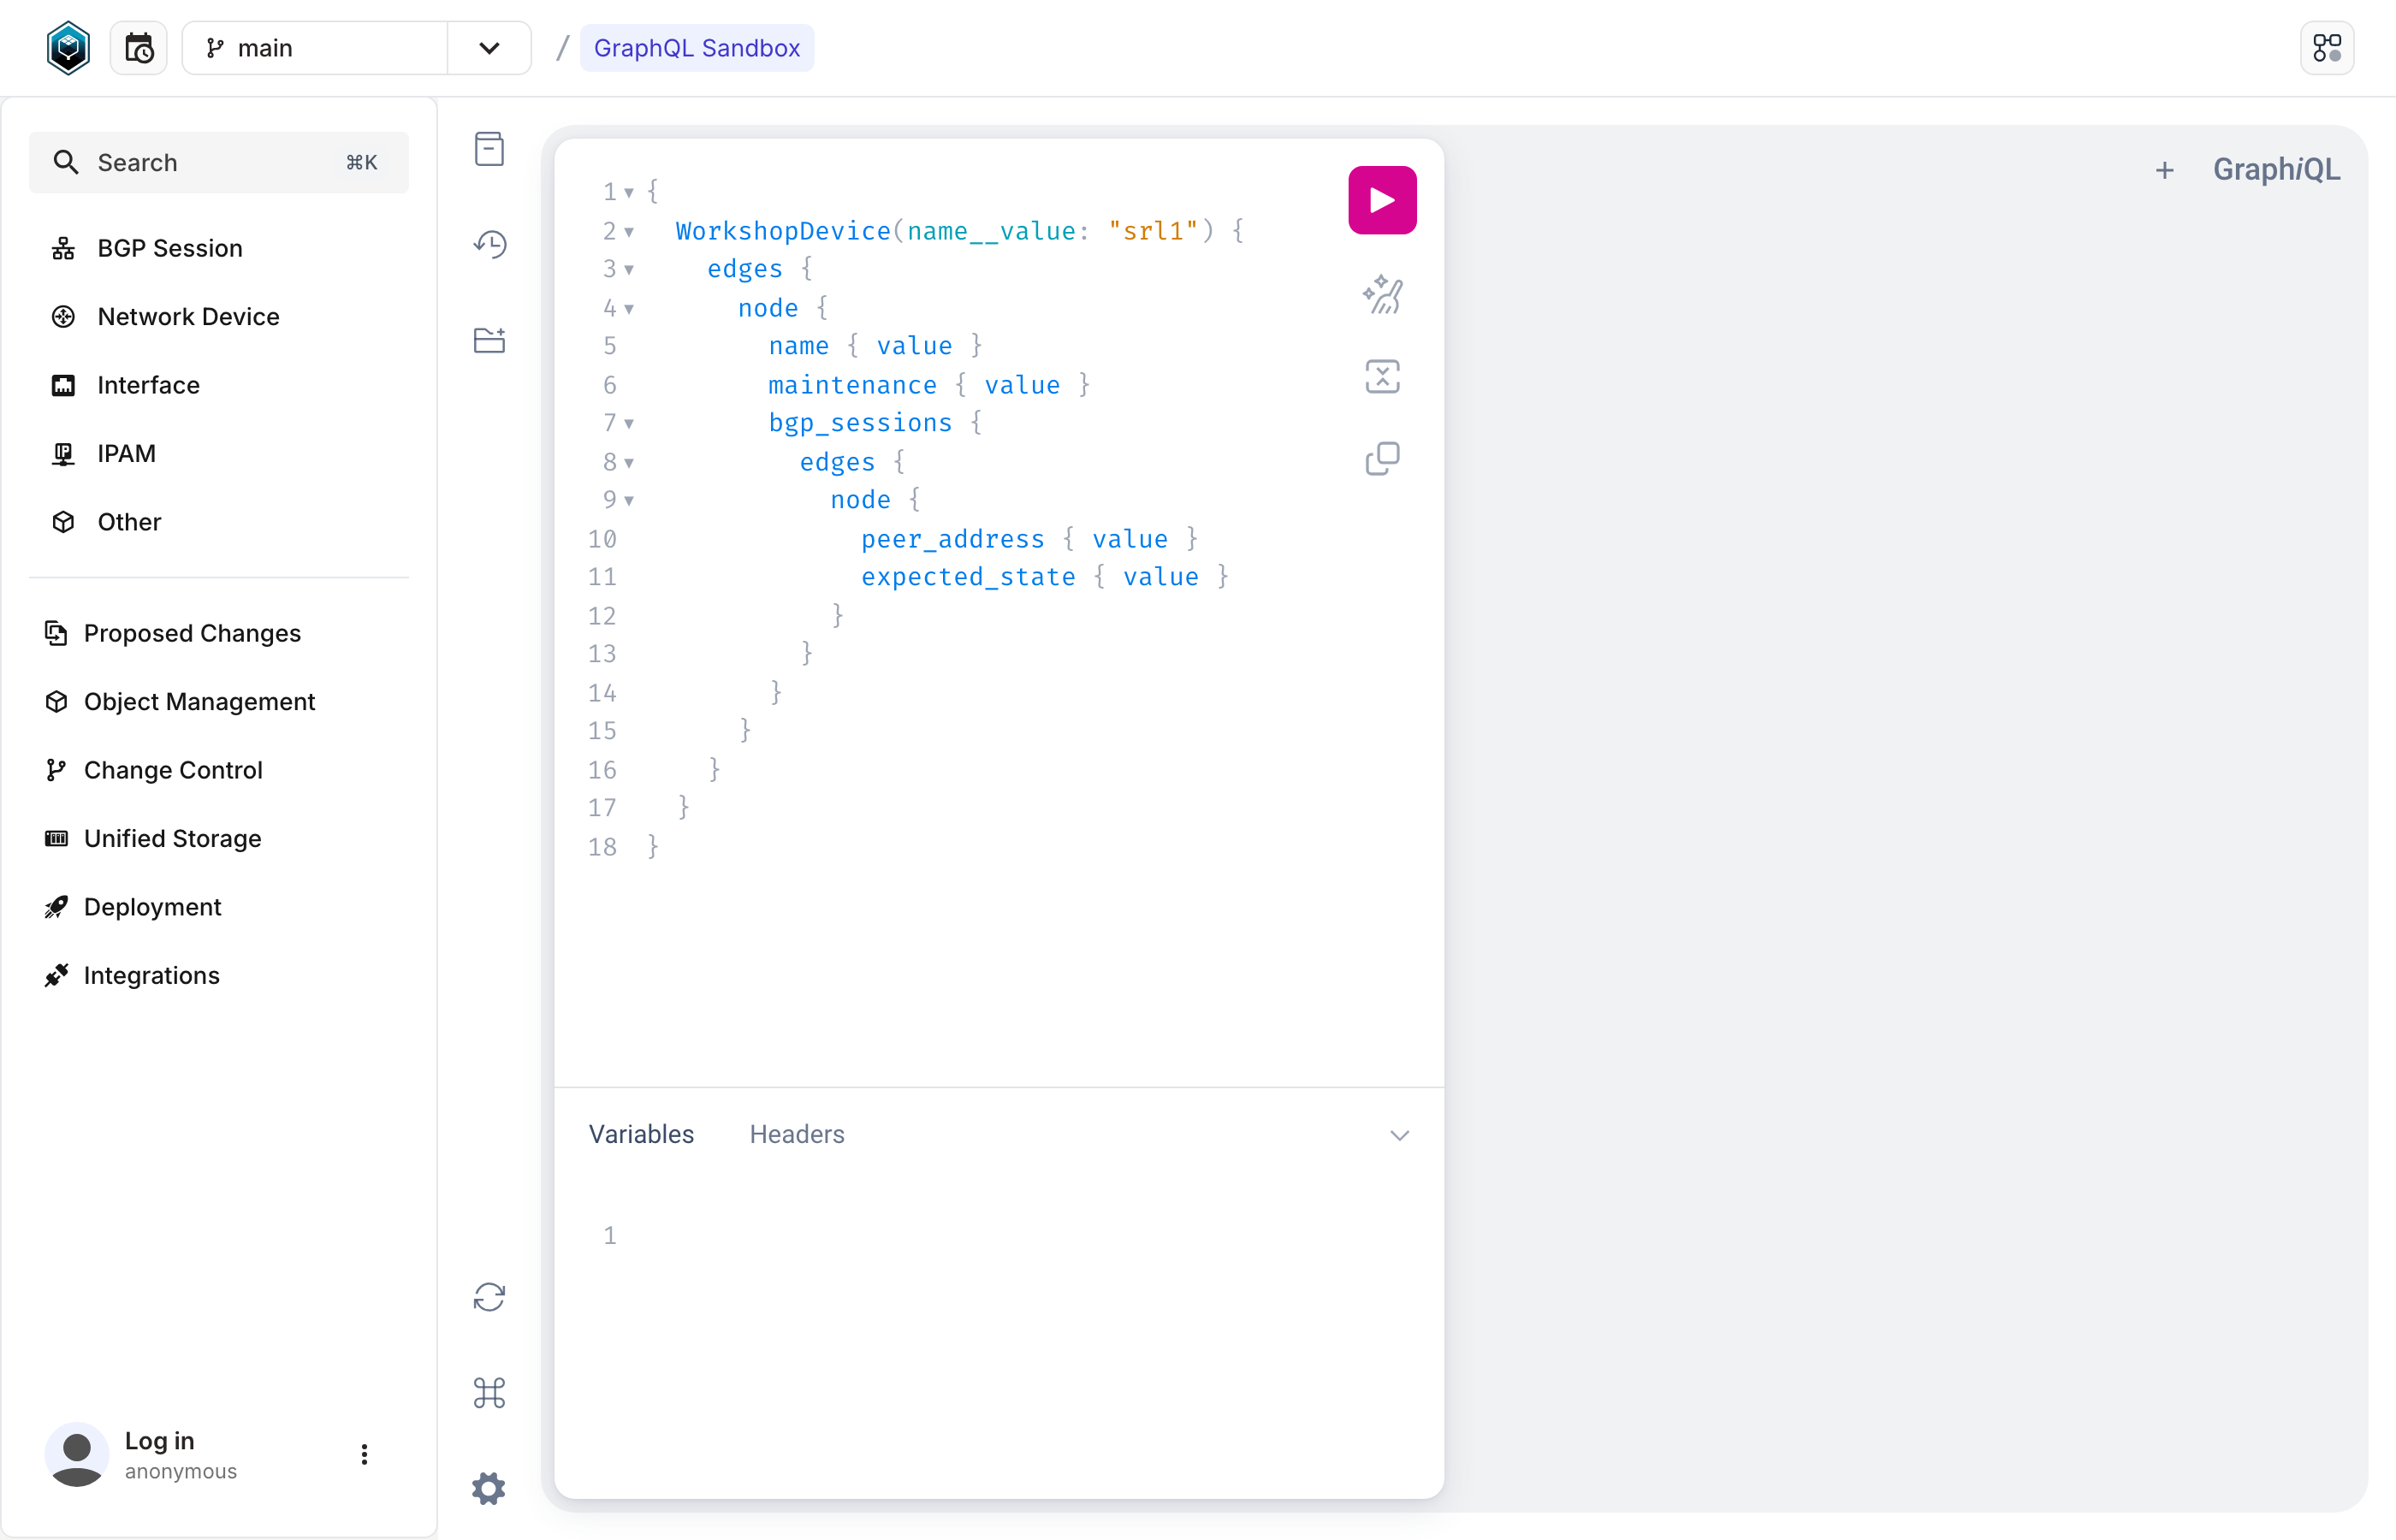
localhost:8000/graphql. The exact DeviceIntent query the Prefect flow runs against Infrahub. No secret access — anyone can run this and see what the policy sees.This is the exact query the Prefect flow runs (verbatim from automation/workshop_sdk.py). Paste it in, hit run, and you'll see the same answer the policy got:
query DeviceIntent {
  WorkshopDevice(name__value: "srl1") {
    edges {
      node {
        name { value }
        maintenance { value }
        site_name { value }
        role { value }
        bgp_sessions {
          edges {
            node {
              peer_address { value }
              expected_state { value }
              remote_as { value }
              reason { value }
            }
          }
        }
      }
    }
  }
}
The flow has no secret access — anything you can read here, it reads with the same query.
Where you'll see this in the workshop
- Part 1 — you cross-reference an alert against intent: "Infrahub says this peer should be
established; Prometheus saysactive." That's the diff that turns a noisy alert into a real incident. - Part 3 — toggling
maintenanceon a device (vianobs autocon5 maintenance --device srl1 --stateor directly in the UI) is what makes the policy take the skip path on the next alert. The flow re-reads Infrahub on every alert.