After the session · your own pace
Take it home¶
Optional exercises to explore at your own pace.
The stack stays on your laptop after the workshop. Bring it back up whenever you have time, then choose the section that interests you.
This page contains the exercises that did not fit into the live session. Work through any section at your own pace; you do not need to finish the whole page.
The stack is still on your laptop and it costs nothing to leave it there. Bring it back up whenever you have an evening:
cd workshops
uv sync --all-packages
nobs packt up
nobs packt status          # repeat until every row says ok
nobs packt load-infrahub
Then choose a section. They are independent, although the order below builds from the basics to the full investigation.
Numbering on this page is the original full sequence
The numbers belong to this longer take-home sequence, so they do not always match the shorter live guides.
| Section | Roughly | What it adds |
|---|---|---|
| Part 1 — recording rules and alerts | 25 min | Where an alert rule actually comes from |
| Part 1 — the capstone and stretch goals | 40 min | All three layers reacting to one event, live |
| Part 2 — the full ten-step panel build | 45 min | Build the panel yourself instead of watching |
| Part 2 — the rest of the alert lifecycle | 15 min | The CLI view and the lifecycle diagram |
| Part 2 — stretch goals | 20–60 min | Three progressively harder dashboard builds |
| Part 3 — swap in a real LLM | 20 min | Your own OpenAI or Anthropic key, side by side with the template |
| Part 3 — deep dives | 30 min | All four paths at once, the Prefect UI, direct triggers |
| Part 3 — stretch goals | 30–60 min | Tail the flows, compare healthy vs broken, aggregate the audit trail |
| Advanced — the 02:14 page | 60–90 min | The whole thing again, alone, end to end |
Part 1 — recording rules and alerts¶
These exercises turn a query into a stored metric, then turn another query into an alert. Do them in order if both ideas are new to you.
Recording rules — composed metrics¶
6. Query a pre-computed metric¶
Your senior opens a file. "Prometheus can run a query for us on a schedule and save the answer under a name. Dashboards can then read that result directly."
A recording rule runs a PromQL query on a schedule and saves the result as a new metric. You query the short name instead of repeating the full expression. This helps because:
- Dashboards do less work. Prometheus calculates the expensive expression once instead of on every panel refresh.
- Dashboards and alerts agree. Both can read the same saved result.
- Long queries get a useful name. Runbooks can refer to that name instead of copying several lines of PromQL.
The naming convention is <aggregation_labels>:<metric_name>:<time_window>. This lab ships two traffic recording rules and one that fans a Loki-derived UPDOWN rate back into Prometheus:
groups:
  - name: network_traffic_overview
    rules:
      - record: device:network_traffic_in_bps:rate_2m
        expr: sum(rate(interface_in_octets[2m])) by (device) * 8
      - record: device:network_traffic_out_bps:rate_2m
        expr: sum(rate(interface_out_octets[2m])) by (device) * 8

  - name: interface_updown_events
    rules:
      - record: device:interface_updown_rate:2m
        expr: events:interface_updown_rate:2m or (sum by (device) (interface_admin_state) * 0)
Try querying the pre-computed metric directly in Explore:
You should see two rows: total inbound traffic for each device, already calculated. The dashboard reads this short metric name instead of running rate() and sum by itself.
Stop and notice. A recording rule does not create new source data. It saves the result of a query so other queries, panels, and alerts can reuse it.
Alerts¶
7. Wrap a query in an alert rule¶
Your senior closes the rules file. "A query answers a question. An alert is the same query with one addition: if the answer is true, act. That's all an alert rule is."
An alert rule runs a PromQL query on a schedule and checks whether its condition is true. A matching result becomes pending, then firing after any configured wait. Prometheus sends firing alerts to Alertmanager, which decides where notifications go and whether any are silenced.
Two fields shape how the alert behaves in practice:
for:says how long the condition must stay true. This prevents one brief bad sample from paging someone.labels:identify and route the alert.annotations:provide the summary and description a person reads.
The expression below asks whether an interface is configured up but currently down. The alert rule runs that question continuously.
The expression¶
Start from the intent-vs-reality query you already know. The operational question is: "Alert when a peer interface is configured UP but operationally DOWN."
count by (device, name) (
  (interface_admin_state{intf_role="peer"} == 1)
  and on (device, name)
  (interface_oper_state{intf_role="peer"} == 2)
) > 0
> 0 is the firing condition — the alert fires whenever at least one interface matches. The count by (device, name) keeps the device and name labels in the alert so the notification knows which interface.
The rule¶
Wrap the expression in an alert rule and add three things that make it operationally useful:
groups:
  - name: interface_intent_mismatch
    rules:
      - alert: InterfaceAdminUpOperDown
        expr: |
          count by (device, name) (
            (interface_admin_state{intf_role="peer"} == 1)
            and on (device, name)
            (interface_oper_state{intf_role="peer"} == 2)
          ) > 0
        for: 2m
        labels:
          severity: warning
          category: network
        annotations:
          summary: "Interface intent mismatch detected"
          description: |
            Interface {{ $labels.name }} on device {{ $labels.device }}
            is configured as UP (admin state) but is currently DOWN (oper state).

            This usually indicates a cabling, peer, or physical-layer issue.
for: 2mwaits two minutes before firing.labels:attach values used for routing and filtering.annotations:build readable notification text. Grafana replaces{{ $labels.name }}and{{ $labels.device }}with the affected interface and device.
Lab: see this alert in the stack¶
The InterfaceAdminUpOperDown alert is already loaded. The lab's deliberately broken interfaces (ethernet-1/11 on both devices) satisfy the expression right now.
-
Prometheus — open http://localhost:9090, run
ALERTS{alertname="InterfaceAdminUpOperDown"}, and expect one firing row per device. If the lab just started, wait two minutes. The alerts page shows the same states without a query. -
Grafana Explore — the
ALERTSmetric exposes firing alerts as a queryable time series:Each row is one firing alert with its
device,name,severity, andcategorylabels. -
Alertmanager — open http://localhost:9093 and confirm the alert arrived and was routed. In Part 3 you'll trace exactly what happens next.
Stop and notice. The query decides what is wrong. The remaining fields decide when to fire, how to route it, and what to tell the on-call.
Part 1 — the capstone and stretch goals¶
If you do only one take-home exercise, choose this one. Four browser tabs and one command show the failure moving from interface to BGP to alerts.
Capstone — everything at once¶
14. Trigger a cascade and watch metrics, logs, and alerts react¶
Your senior gestures at the keyboard. "One command will start the fault. Watch the interface, BGP session, logs, and alert respond in that order."
This is the capstone exercise for Part 1. Open four browser tabs before you run anything:
| Tab | What to open |
|---|---|
| Metrics | Grafana Explore — prometheus datasource |
| Logs | Grafana Explore — loki datasource |
| Alerts | Prometheus alerts |
| Alertmanager | http://localhost:9093 |
Step 1 — set up your metric queries. In the metrics tab, load these four queries (use split view or separate tabs):
Switch all four to Time series view. Leave them running — Grafana auto-refreshes.
Step 2 — set up your log stream. In the logs tab, run:
Switch to Live mode (the toggle in the top-right of Explore). Log lines will stream in as they arrive.
Step 3 — trigger the cascade. In a terminal:
This starts a four-minute scripted incident. The interface alternates between 30 seconds up and 60 seconds down. BGP follows about 10 seconds after each failure, and all values recover when the incident ends.
Trip just the flap, not BGP
Pass --no-cascade and only the interface metric and UPDOWN log stream fire — BGP stays clean. Useful for testing the PeerInterfaceFlapping alert without bringing a session down.
Step 4 — watch each layer respond in order.
Metrics:
interface_oper_stateflips from1→2immediately when the interface goes down.- ~10 seconds later,
bgp_oper_statefollows from1→2(BGP hold-down timer). bgp_prefixes_accepteddrops to0on the same beat.- Interface traffic drops to
0 kb/sduring each DOWN phase. Here's the chain of cause and effect:rate()measures how fast the byte counter is going up.- During DOWN, no traffic is flowing through the interface, so no bytes get added to the counter.
- The counter itself doesn't disappear — it just sits at whatever number it had reached when the interface went down.
- When the interface comes back up, traffic starts flowing again and the counter picks up where it left off — no fake spike, no false alarm.
- When the interface recovers, every gated series snaps back:
bgp_oper_state→1, prefix counters →10. Dashboards go green within one scrape cycle.
Logs:
UPDOWN log lines start appearing in the live stream within seconds of the first down phase. Each line carries the same device, interface, and vendor_facility_process labels as the metrics — that label alignment is what makes the bridge exercise possible.
Alerts:
- After ~30 seconds in the down state, check the Prometheus alerts page. You should see
PeerInterfaceFlappingmove fromINACTIVE→PENDING→FIRINGas the UPDOWN event count crosses the threshold and holds forfor: 30s. - Once
FIRING, switch to Alertmanager — the alert arrives there routed by itsseverityandcategorylabels. In Part 3 you'll trace exactly what the webhook does with it.
Stop and notice. The interface fails first, BGP and routes follow, logs explain the change, and the alert fires last. That order helps you separate the cause from its later symptoms.
Stretch goals (optional — pick one if you have time)¶
-
Find the busiest interface in the last 5 minutes. Combine
topkwithrate()oninterface_in_octets. Which interfaces show up?Solution — the query + what it returns
Three rows, one per "busiest" interface across both devices:
srl2 / ethernet-1/10    ~12,700 bytes/sec
srl2 / ethernet-1/1     ~12,700 bytes/sec
srl1 / ethernet-1/1     ~12,700 bytes/sec
At rest, healthy interfaces receive traffic at about the same rate, so
topkmay return any three of them. During a flap, the affected interface stops increasing while it is down and may leave the list. -
List every distinct severity level present in srl1 logs in the last hour. What does the lab actually seed?
Solution — the query + three severity buckets
Parse the lines with
| jsonthen aggregate by the parsed field:Three rows fall out:
severity count (varies, ballpark) info~120 (BGP state changes, link UP events) warn~70 (broken peer retries, admin-up/oper-down events) error~15 (BGP neighbor "connection refused" lines) The lab uses
infofor routine events,warnfor the always-broken interface, anderrorfor the broken BGP peer. -
Run the broken-peer query against srl2 only. Same shape as exercise 5 (the intent-vs-reality BGP query), but scoped to one device. Confirm you get exactly one row.
Solution — the query + the one row it returns
bgp_admin_state{device="srl2"} == 1
  and on (device, peer_address)
bgp_oper_state{device="srl2"} != 1
Returns exactly one row:
This is srl2's deliberately broken peer. The same query works on both devices because Part 1 made their metric and label names consistent.
-
Plot CPU and memory side by side. Two queries in one Explore panel — what should both lines look like at rest?
Solution — the queries + expected ranges
Both metrics are sine waves the synthetic emitter produces:
cpu_used{device="srl1"}≈ 10–40% (amplitude 15, offset 25, period 120s)memory_utilization{device="srl1"}≈ 34–50% (amplitude 8, offset 42, period 240s)
Both stay low by design. If either reached 80–90%, the device itself would deserve investigation.
-
Inspect the raw shape Telegraf normalizes. Compare the three layers of the pipeline directly — what does the same fact look like before Telegraf, after Telegraf, and after Prometheus has stored it?
Solution — three URLs walking the same fact through three shapes
Click each URL and grep for one specific metric:
- http://localhost:8085/scenarios/metrics?label=agent_host:srl2 — raw SNMP (pre-Telegraf):
bgpPeerState,ifHCInOctets,agent_host=srl2 - http://localhost:9006/metrics — telegraf-srl2's normalized output:
bgp_oper_state,interface_in_octets,device=srl2 - http://localhost:9090/graph?g0.expr=bgp_oper_state%7Bdevice%3D%22srl2%22%7D&g0.tab=1 — Prometheus stores the same data after one more scrape hop
For one line of
bgp_active_routeson srl2, you'll see roughly:Layer What it looks like Sonda raw (before Telegraf) bgpPeerInPrefixes{agent_host="srl2", bgpPeerRemoteAddr="10.1.11.1", ...} 10Telegraf /metrics(after rename)bgp_active_routes{collection_type="snmp", device="srl2", peer_address="10.1.11.1", ..., pipeline="telegraf"} 10Prometheus (after one more scrape) identical to the line above — Prometheus just stores it The value stays
10at every step. Only the names change. The rules are inworkshops/packt/telegraf/telegraf-srl2.conf.toml. - http://localhost:8085/scenarios/metrics?label=agent_host:srl2 — raw SNMP (pre-Telegraf):
Part 2 — the full ten-step panel build¶
Here is the complete click-by-click build. To restore the original Workshop Lab 2026 dashboard first, run nobs packt restart grafana.
Build the dashboard panel¶
You're adding a flap rate panel: the number of UPDOWN log events per interface during the last two minutes. Its thresholds match the PeerInterfaceFlapping alert rule.
1. Enter edit mode¶
"Click Edit, top right of the dashboard. The floating sidebar on the right is where you add things."
Adding a panel in Grafana 13 takes a few clicks:
-
Click Edit (top-right corner of the dashboard). A right sidebar appears with a column of icons — hover each to see its name. From top to bottom they are:
Icon Hover name What it does +Add Add a new panel, row, or dashboard control ⚙ Dashboard options Settings, variables, annotations, links 💬 Give feedback Grafana-internal feedback prompt (ignore) {}Code View the raw dashboard JSON ↓ Export Export the dashboard ≡ Outline Jump to any panel by name -
Click the
+(Add) icon — top of that sidebar. An Add menu opens with Panel, Group layouts (Group into rows, Group into tabs), and Dashboard controls (Variable, Annotation query, Link). - Click Panel. An empty panel lands on the dashboard, and the right sidebar changes to show the new panel's settings — Title, Description, Transparent background, Repeat options.
- Click the big blue Configure button at the top of those settings to open the panel editor — query box at the bottom, panel preview at the top, visualization options on the right.
New to Grafana? For Grafana itself — panel editor internals, the time picker, dashboard variables — see the upstream Grafana docs. Keep one open in another tab while you build.
2. Pick the datasource¶
"This panel counts log events, so its data comes from Loki."
Choose loki in the datasource picker. Part 1's log-counting exercise explains the same count_over_time(...) pattern.
3. Write the query¶
"Count UPDOWN events for each interface during the last two minutes. Use the dashboard variable so one panel works for both devices."
The query box defaults to Builder mode — a click-to-build form with Label filters and Operations. To paste a raw LogQL query, toggle to Code mode using the Builder | Code switch on the right side of the query toolbar.
In the Loki query box (now in Code mode), paste:
Read the query from the inside out:
- The braces keep UPDOWN logs for the device selected in the dashboard.
count_over_time(...[2m])counts those logs during the last two minutes.sum by (interface)gives each interface its own line.
Click Run query. The panel is usually empty before you trigger a flap. You may briefly see ethernet-1/11 at 1; that interface is broken by design and writes about one event every two minutes.
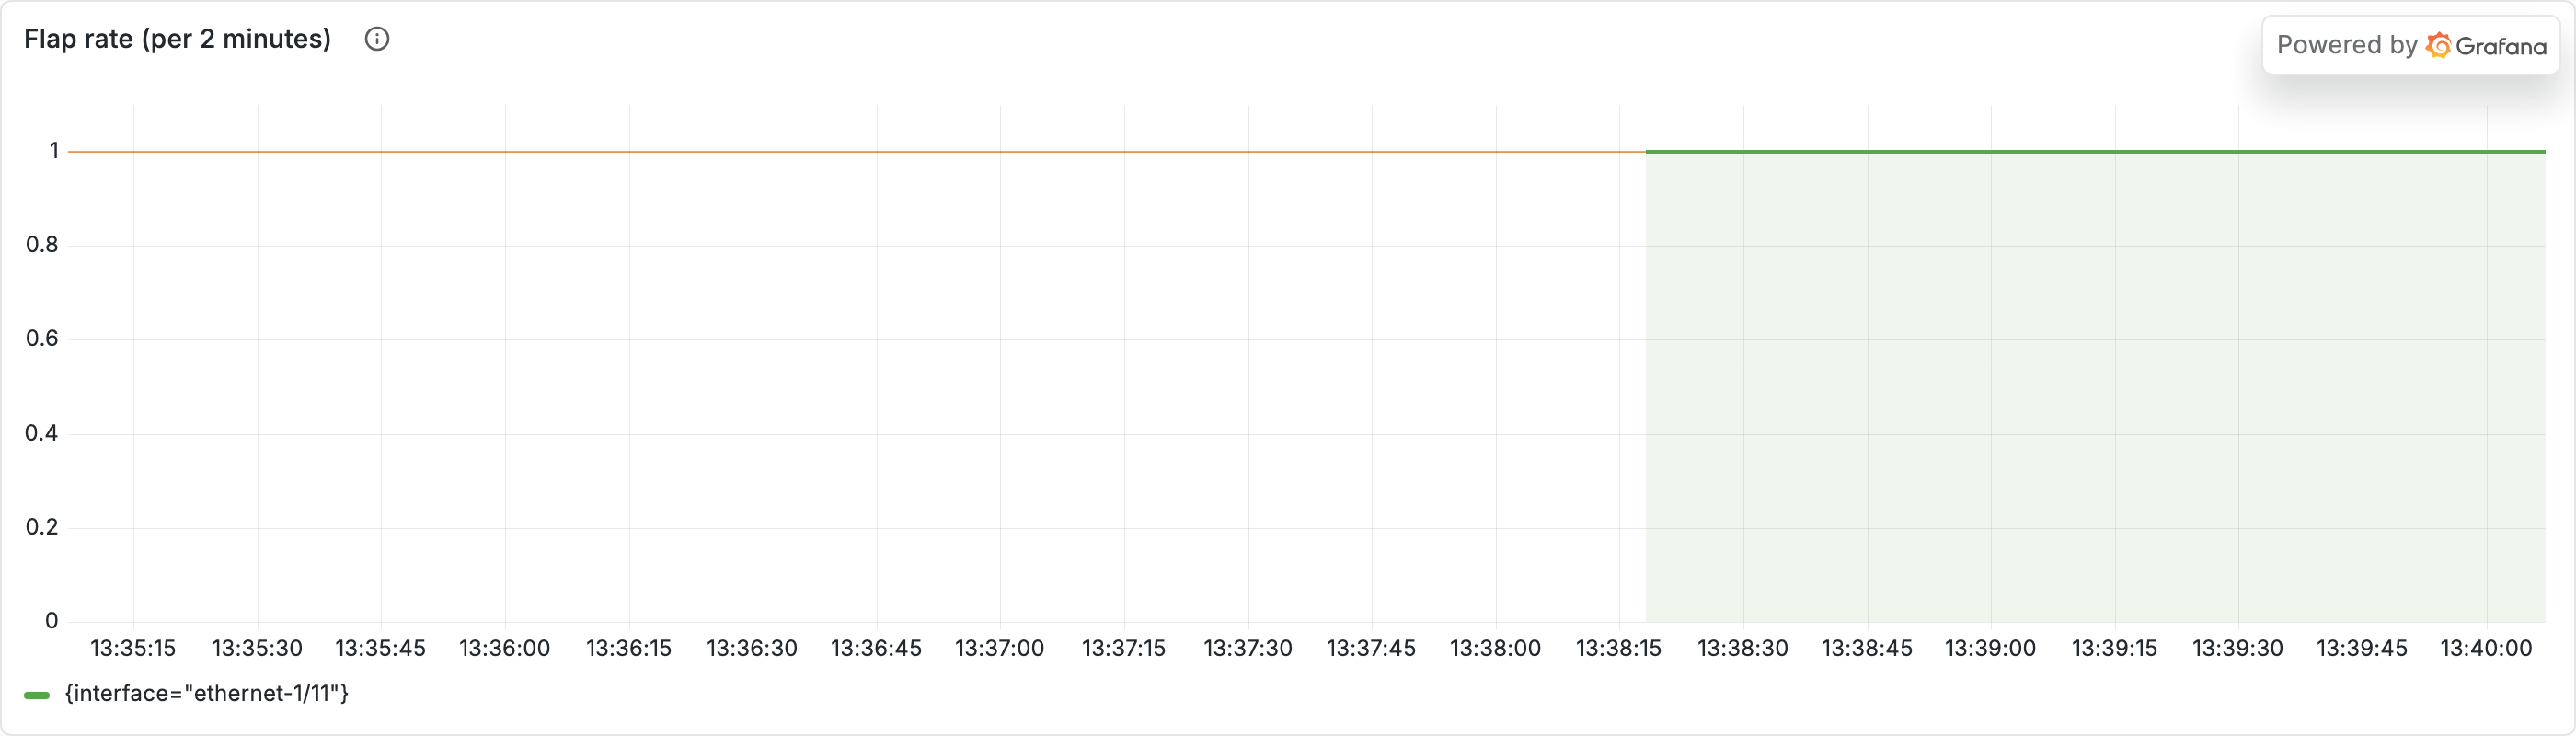
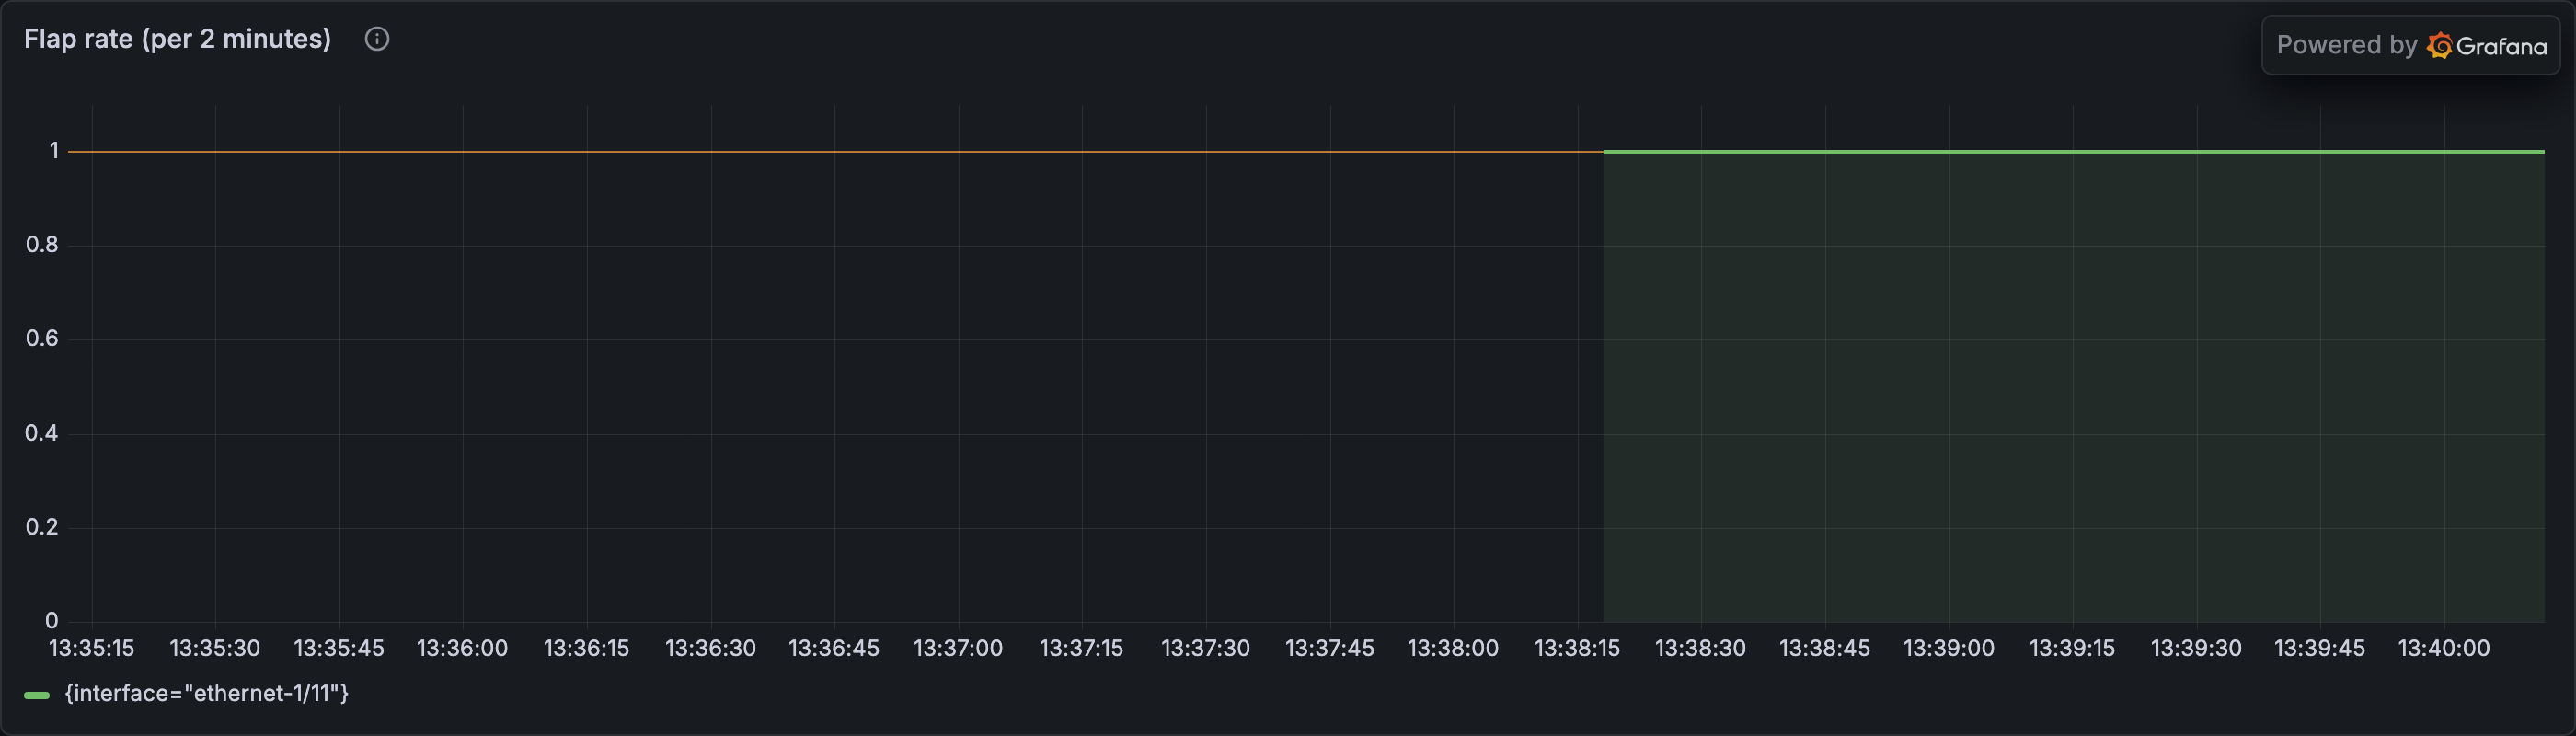
ethernet-1/11 at 1 (the only interface that's actually flapping at rest, because it's broken by design). The other peer interfaces are silent. Anything else here means a real flap is in progress.Empty panel?
Two reasons the panel might look empty:
- The
Devicedropdown above the dashboard isn't set to a real device. Toggle it tosrl1orsrl2. - The broken-interface log emitter fires only every ~2 minutes — the panel goes back to empty between events. Wait a minute or two for the next one to land.
4. Pick the panel type¶
"Time series for this. Aggregations over time always read better as a line graph than a table."
The right-hand sidebar has two tabs at the top: Suggestions (a curated short list based on your query shape) and All visualizations (the full set). Click All visualizations and pick Time series. (It usually shows up in Suggestions too — either path works.)
5. Title and description¶
"Title and description matter. The panel needs to tell the next on-call what they're looking at without you being there to explain it."
You can set these in two places — pick whichever is in front of you:
- In the panel settings sidebar before you clicked Configure (the Title and Description fields are right at the top).
- In the panel editor, scroll the right-hand options to Panel options → Title / Description.
Either way, use:
- Title:
Flap rate (per 2 minutes) - Description:
UPDOWN log events per interface in a rolling 2-minute window. Above 3, the PeerInterfaceFlapping alert fires — the panel uses the same window so the red threshold line is the alert condition.
Description shows up as a small i icon on the panel — students hovering it later get the context without leaving the dashboard.
6. Set thresholds that match reality¶
"Now thresholds. The PeerInterfaceFlapping alert fires when count_over_time over 2 minutes exceeds 3. Match that — when the threshold line moves, the alert is right behind it."
The PeerInterfaceFlapping alert fires when count_over_time({vendor_facility_process="UPDOWN"}[2m]) > 3. Mirror that on the panel so the threshold line is the alert condition:
In the right-hand options pane, scroll down to find the Thresholds section — it's usually about eight sections down, past Panel options, Tooltip, Legend, Axis, and Graph styles. Set:
| Color | Value | What it means |
|---|---|---|
 Green Green |
base (default — keep it) | "everything's quiet" |
 Orange Orange |
2 |
"early heads-up — activity above the always-broken ethernet-1/11 baseline (which sits at 1)" |
 Red Red |
3 |
"alert firing — the PeerInterfaceFlapping rule's > 3 condition has been crossed" |
Under Graph styles → Show thresholds, choose As lines. You should see orange at 2 and red at 3. Orange is an early warning above the broken interface's usual value of 1. Crossing red makes the alert condition true; the rule then waits 30 seconds before firing.
Your senior glances over. "Thresholds matching the alert rule? Good. When the line crosses the orange one, an interface just logged a state change — that's your early heads-up. When it crosses the red one, the alert is firing and someone's pager goes off. The panel makes both moments visible without a separate alerts pane."
7. Smooth out the gaps¶
"When no matching logs arrive, the query returns a gap. Connect those gaps so the line is easier to follow."
In the right-hand options, still in the Graph styles section where you set the threshold lines, find Connect null values and change it from Never to Always.
Now when the 2-minute window briefly has no matching log lines, the panel draws a continuous line through the gap instead of showing disconnected dots. Easier to read at a glance during a flap.
8. Save¶
Top right of the panel editor, click Save to return to the dashboard. Then click Save (the blue button, top-right of the dashboard) to save your work. Grafana confirms Dashboard saved. The new panel is now part of Workshop Lab 2026. Use Exit edit next to it when you're done editing for the session.
9. Drive a flap¶
"OK. Panel's there. Doesn't mean anything until we see it react. Drive a flap."
In a terminal:
This starts a four-minute scripted incident. The interface alternates between 30 seconds up and 60 seconds down. While it is down, the lab writes about one UPDOWN event every two seconds. Set the dashboard's Device dropdown to srl1.
Turn on auto-refresh so the panel updates live
By default the dashboard only re-queries when you reload it. To watch the flap climb in real time, click the circular arrow icon at the top-right of the dashboard (next to the time-range picker) and pick 5s from the dropdown. The panel will re-query every 5 seconds — fast enough to catch the cascade as it unfolds, slow enough not to hammer the backends. Set it back to Off when you're done.
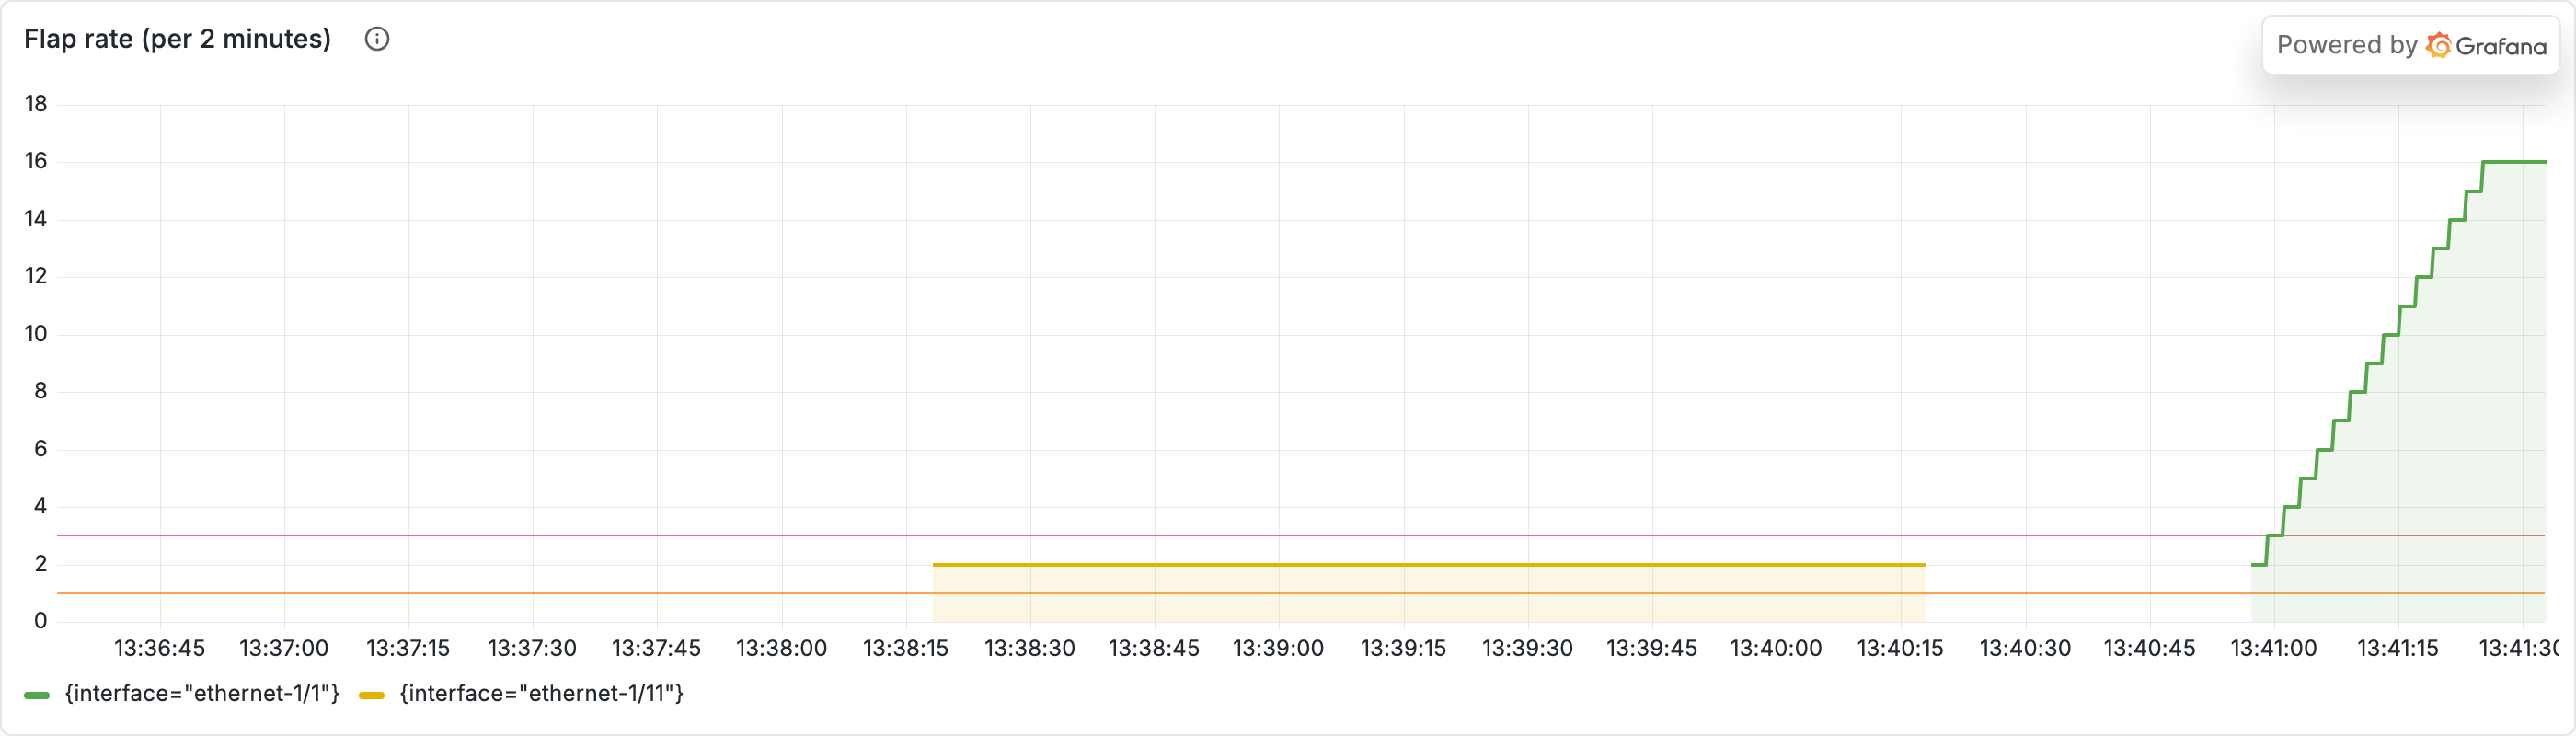
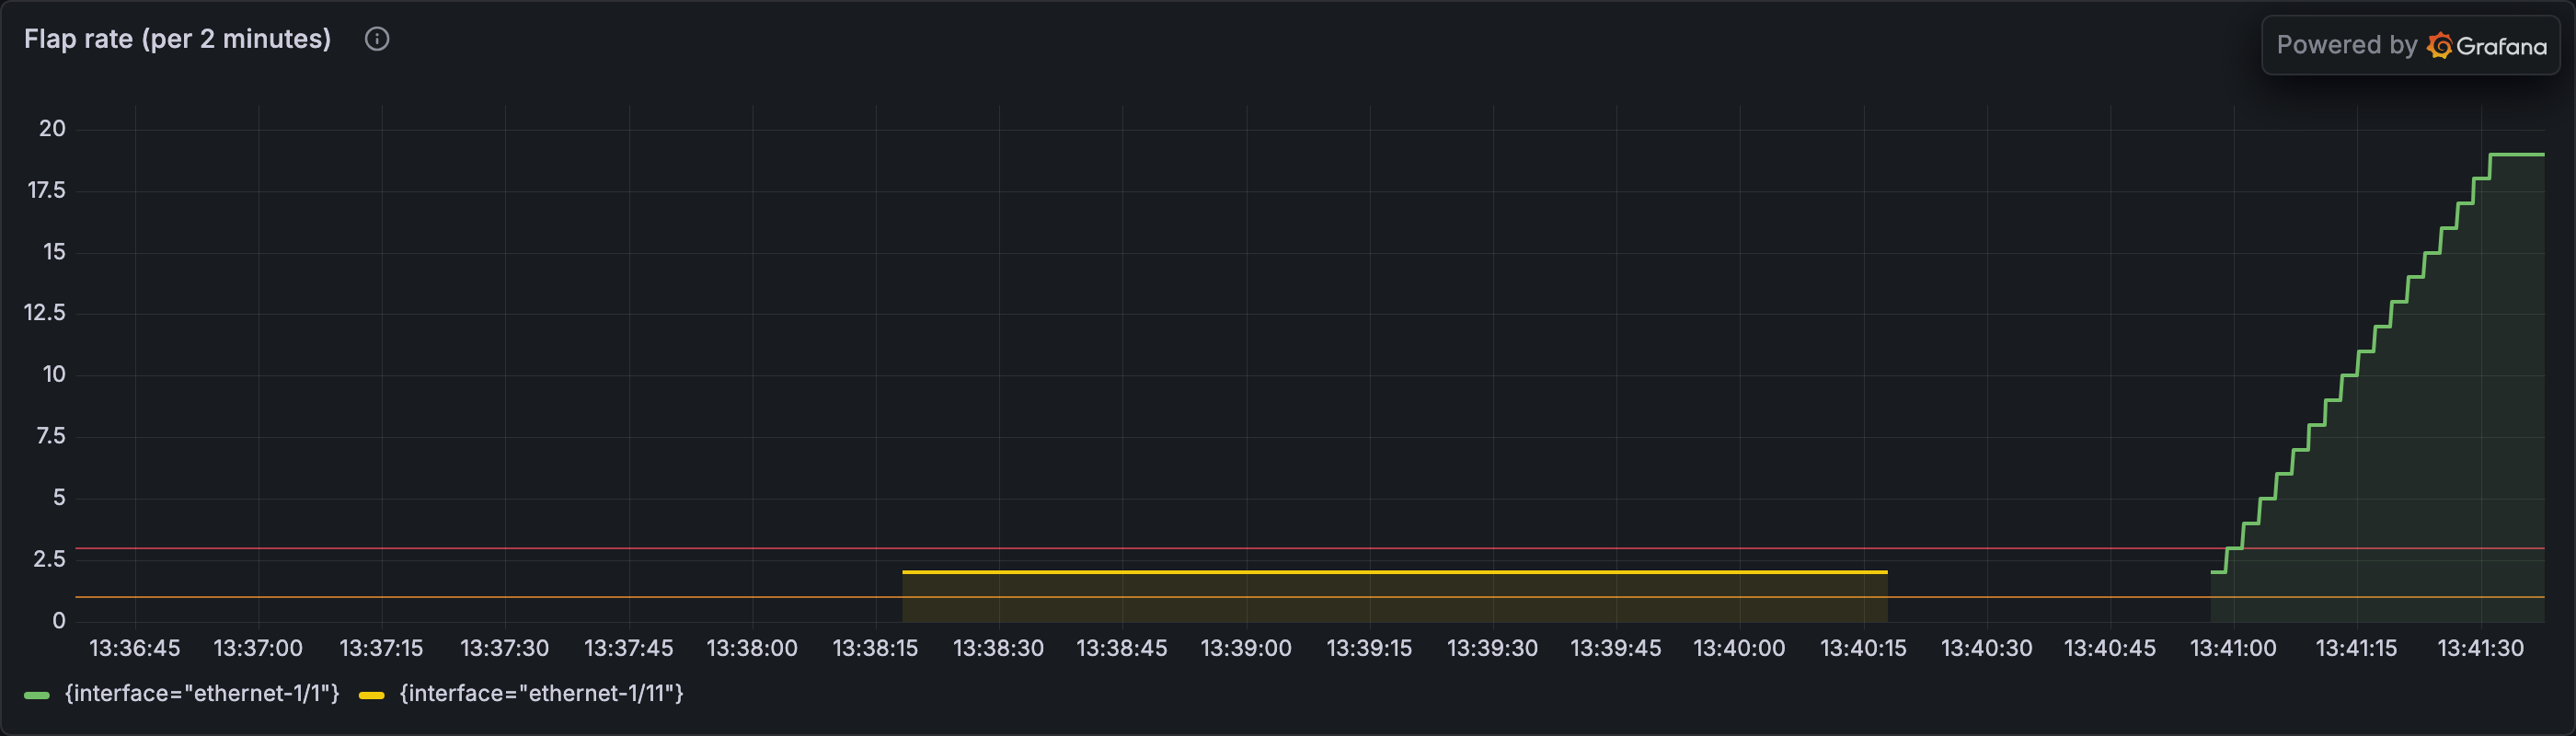
ethernet-1/1, climbing fast past the orange threshold (2) and through the red threshold (3) on its way to 16+. You may also see a faint yellow series line for ethernet-1/11 at 1–2 (that's the Grafana-assigned color for that interface, not a threshold) — the broken-interface log emitter fires at random intervals (roughly once every 2 minutes), so it isn't always inside the 2-minute window the panel is counting. Either way, the flapped interface is the obvious anomaly against an otherwise quiet panel.What you should see:
- The first 45 seconds are quiet because the interface starts up.
- Around one minute,
ethernet-1/1appears and quickly crosses both thresholds. - The count may flatten while the interface is up, then climb during the next down period.
- It falls only after older events leave the two-minute window.
Your senior taps the screen. "Watch the orange line — that's the early heads-up, an interface just logged a state change. Watch the red line — that's where someone's pager goes off because the alert rule fired. The panel makes both moments visible without a separate alerts pane."
Stop and notice. This is the same query pattern that drives the PeerInterfaceFlapping alert in Part 3. The panel isn't decoration — it's a visual representation of the rule that's about to fire. When the on-call gets paged, this panel is what they look at first.
10. Switch device variable¶
"Now the proof that the variable was worth it. Toggle to srl2 and drive a flap there. No editing the panel — the dashboard does the work."
Toggle the Device dropdown to srl2. The flap-rate panel re-queries and now shows srl2's steady-state — mostly silent, with at most a single tick from the always-broken ethernet-1/11 every two minutes. Same as srl1 before you triggered its flap.
Trigger:
Watch the spike land on srl2's ethernet-1/10 line — same ramp shape, same threshold crossings, same recovery — without you editing the query.
Stop and notice. One panel, two devices. That's what the dashboard variable bought you. If you'd hard-coded device="srl1" in the query, you'd need a duplicate panel for every device you ever add — and one to maintain per device when the schema changes.
The panel works for both devices because Part 1 made their different source names consistent before storage. Revisit the before-and-after comparison if you want a refresher.
Your senior nods at the screen. "That's the panel. Six hours from now when somebody on the rotation gets paged on a similar shape, this view is on screen the moment they open the dashboard. Ten minutes saved off the next triage. That's the work."
Part 2 — the rest of the alert lifecycle¶
These two exercises show the alert states in the terminal and then place those states in one diagram.
2. Inspect alerts from the CLI¶
The lab ships a small CLI that prints the current alert state in a table — same data Alertmanager has, just rendered for terminal use:
Wait about 90 seconds after
flap-interface. The event count must cross 3 and remain there for 30 seconds before the alert changes frompendingtofiring.
Once it fires, expect five rows in two groups:
- Steady-state alerts — always there, every time you walk this lab:
InterfaceAdminUpOperDown × 2—ethernet-1/11on each device is wiredadmin upbut itsoperstate isdown(the always-broken interface from step 3). The rule matches continuously; it never ages out.BgpSessionNotUp × 2— two deliberately broken BGP peers (srl1 → 10.1.99.2,srl2 → 10.1.11.1). Same shape: the rule matches continuously. Part 3 picks these up and acts on them.
- Transient alerts — appear when something happens, age out when it stops:
PeerInterfaceFlapping— fires when your flap's rolling 2-minute count crosses> 3. Severitycritical, scoped to the specific interface (srl1/ethernet-1/1if you flapped that). Resolves and ages out within ~5 minutes after the cascade ends.
Now run the command and read the output:
| Alertname                | Severity | Device / target  |   State |  Age |
| InterfaceAdminUpOperDown | warning  | srl1             |  firing |  ... |
| InterfaceAdminUpOperDown | warning  | srl2             |  firing |  ... |
| BgpSessionNotUp          | warning  | srl1 → 10.1.99.2 |  firing |  ... |
| BgpSessionNotUp          | warning  | srl2 → 10.1.11.1 |  firing |  ... |
| PeerInterfaceFlapping    | critical | srl1 → ethernet-1/1 |  firing | 30s |
Four steady-state rows + one transient — and the last column (Age) tells you which is which at a glance: ... (long-running) vs 30s (new).
Your senior glances at the screen. "Two-tier shape — the always-broken stuff sits there forever, and the things you actually want to know about come and go. Both are useful. The always-broken alerts tell you the lab knows about a problem someone hasn't fixed. The transient ones tell you something happened just now."
7. The lifecycle in one diagram¶
   rule starts matching
            │
            ▼
        pending   ◄── for: 30s — the condition must hold this long first
            │
            ▼ (30s elapsed)
         firing   ◄── notifications go out (webhook, email, …)
            │
       ┌────┴────┐
       │         │
       ▼         ▼
  suppressed   resolved
  (silence    (condition
   applied)    stopped matching)
       │              │
       ▼              ▼
  (silence       (if the condition
   expires)      starts matching
       │         again, the alert
       ▼         re-enters `pending`)
     firing  ─── continues until condition resolves
If a resolved condition becomes true again, the alert returns to pending and starts the cycle again.
Why has BgpSessionNotUp been sitting in firing this whole time? — preview of Part 3
Both peers are broken by design, so BgpSessionNotUp remains active. Part 3 shows a workflow receiving those alerts, checking their context, and applying the same kind of silence you created by hand.
You have now seen the same alert in the CLI, Alertmanager, and Grafana, and you have silenced one manually. Part 3 automates that response.
Part 2 — stretch goals¶
Stretch goals (optional — pick one if you have time)¶
Extend the Interface Traffic panel with a per-device aggregate¶
The existing Interface Traffic panel draws one line per interface. Add a second query that draws a single device-wide total on the same panel, styled so it visually stands out from the per-interface lines.
Solution — steps + what the panel looks like after
Open the Interface Traffic panel in edit mode. The per-interface queries already in the panel multiply by * 8 to convert bytes/s into bits/s — anything you add must do the same or it'll render 8× smaller than the existing lines.
1. Add the aggregate query. Click + Add query below the first query. Paste the in+out aggregate, with the same unit conversion and the same rate window as the existing queries:
sum(rate(interface_in_octets{device="$device"}[$__rate_interval])) * 8
  + sum(rate(interface_out_octets{device="$device"}[$__rate_interval])) * 8
2. Name the new series so the override can target it. Below the query, in the per-query Options row, set Legend to Custom and type Summary in the field next to it. Without this step Grafana auto-names the series from its labels, which makes the next step harder — you'd have to target a label-based name like {} instead of a stable, friendly one.
3. Make it visually stand out. In the right-hand options panel, scroll to Overrides → + Add field override → Fields with name → pick Summary from the dropdown. Then click + Add override property (once per property) and add:
- Graph styles → Line width:
3(thicker than the per-interface lines) - Graph styles → Line style:
Dash(or pick a distinct colour instead — whichever reads more cleanly on your screen)
What the panel should look like after. Two queries in the panel, both multiplied by * 8 (bits/s):
| Query | Expression | Legend |
|---|---|---|
| A (existing — in) | rate(interface_in_octets{device="$device"}[$__rate_interval]) * 8 |
(auto) |
| A (existing — out) | rate(interface_out_octets{device="$device"}[$__rate_interval]) * 8 |
(auto) |
| B (new) | sum(rate(interface_in_octets{device="$device"}[$__rate_interval])) * 8 + sum(rate(interface_out_octets{device="$device"}[$__rate_interval])) * 8 |
Summary (custom) |
Plus one Override on Fields with name = Summary:
- Graph styles → Line width:
3 - Graph styles → Line style:
Dash(or a distinct colour)
Result on screen: per-interface in/out lines tracking around ±50–100 kb/s, plus one thicker dashed Summary line sitting above them at roughly the absolute sum of the others.
Build a flap-history table with drill-through¶
Your senior leans back in. "Time-series tells you the shape. A table tells you the list — which device, which interface, how many flaps, click here to investigate. Build the second one. Make the device column a link into Device Health so a click takes you straight to the right view."
Add a second panel: a table that summarises flap activity per device + interface over the last hour, with the device column as a clickable link into the Device Health dashboard, preserving the time window. This is the densest stretch goal — budget ~20 minutes if you're new to Grafana table panels, transformations, and data links.
Solution — full 8-step build + what the table looks like after
1. Add the panel. Back on the Workshop Lab 2026 dashboard: click Edit, click the + in the right sidebar, click Panel, then click Configure in the panel settings that appear. Pick the loki datasource.
2. Write the query. Toggle the query box to Code mode (the Builder | Code switch on the right of the query toolbar). Paste:
A 1-hour window is "what's been flapping today" — wider than the 2-minute alert window so the table holds stable rows even between flaps.
Below the query box, expand Options and switch Type from Range to Instant. Instant gives the table one current value for each device and interface. Range would add a row for every point in time.
Click Run query.
3. Switch the panel type. On the right-hand sidebar, click the All visualizations tab and pick Table. The result lands as a single-row table with a value column and the labels mashed into one cell — that's because Loki returns time-series-shaped data and the table needs help turning labels into proper columns.
4. Turn labels into table columns. Below the query box, click Transformations → Add transformation.
- Pick Labels to fields. Each Loki label (
device,interface) becomes its own column. - Add a second transformation (click Add another transformation): Organize fields by name. Hide
Time(click the eye icon next to it — the table doesn't need it), reorder sodeviceis first andinterfacesecond, and renameValue #AtoTotal flapsin the rename input next to that row.
You should now see one row per device + interface pair, with three clean columns: device, interface, Total flaps.
5. Title and description. Right-hand options → Panel options:
- Title:
Flap history (last 1h) - Description:
UPDOWN events per device + interface over the last hour. Click any device cell to drill into Device Health for that device, time range preserved.
6. Colour-code the flap counts. Right-hand options → Overrides → Add field override → Fields with name → pick Total flaps. Then add:
- Cell options → Cell type:
Gauge - Cell options → Gauge display mode:
LCD gauge(the retro pixel-bar style — coloured stripes that fill horizontally) - Standard options → Min:
0 - Standard options → Max:
100 - Thresholds (set them inside this same override): Green base, Orange at
30, Red at60
These thresholds are higher than the earlier panel because this table counts a full hour. The lab's always-broken interfaces produce about 28 events in that time, so values above 30 show extra activity.
Each row's Total flaps cell now renders as a horizontal LCD bar that fills green → yellow → red as the count climbs. At-a-glance triage without reading numbers.
7. Make the device cell a link. Still in the right-hand options, scroll to Overrides → Add field override → Fields with name → pick device. On the override:
- Cell options → Cell type:
Auto(orColor textif you want the link visually distinct). - Data links → Add link:
- Title:
Open Device Health for ${__value.text} - URL:
/d/c78e686b-138b-4deb-b6ae-3239dc10a162?var-device=${__value.raw}&from=${__from}&to=${__to}
- Title:
${__value.raw} is the cell's raw label value (srl1, srl2). ${__from} and ${__to} are the dashboard's current time-range bounds — the link carries the window forward so the destination dashboard opens on the same minutes you were just looking at.
8. Save and try it. Apply, then Save dashboard. Trigger a flap:
Within a minute, a row for srl1 / ethernet-1/10 shows up with a climbing Total flaps count. Click the srl1 cell. Grafana jumps to Device Health, scoped to srl1, on the same time range you were on.
What the table should look like after. Three clean columns (no Time, no Value #A — those got hidden / renamed by the Organize-fields transformation), four rows at rest:
| device | interface | Total flaps |
|---|---|---|
| srl1 | ethernet-1/1 | (number with horizontal LCD bar) |
| srl1 | ethernet-1/11 | ~28 (mostly green bar) |
| srl2 | ethernet-1/10 | (number with horizontal LCD bar) |
| srl2 | ethernet-1/11 | ~28 (mostly green bar) |
Visual cues:
- The
devicecells are blue underlined links. Clickingsrl1takes you to Device Health withvar-device=srl1and the dashboard's current time range carried forward. - The
Total flapscells render as horizontal LCD gauges that fill green → orange → red as the count grows. Background noise (always-broken interfaces) sits around 28 (mostly green). An actively-flapping interface climbs past 60 in a few minutes and goes mostly red.
Stop and notice. The chart shows when flapping happened. The table shows which interface flapped and gives you a direct link to investigate it without losing the time range.
Group the dashboard into tabs¶
Use Grafana's Group into tabs feature to arrange the dashboard by question instead of showing all eight panels at once.
Solution — steps + what the dashboard looks like after
Grafana 13's Group into tabs works like browser tabs: only the active tab's panels render, so the page feels lighter and the queries run faster.
In Edit mode, click + in the right sidebar, then Group into tabs. Drag panels into each tab using the layout below — a useful split for a real on-call:
| Tab | Panels to include | What this tab answers |
|---|---|---|
| Overview | Devices · Interfaces · Firing alerts · Log lines (5m) | "Is anything wrong right now?" |
| Interfaces | Interface Admin State · Interface Operational Status · Interface Traffic · Interface Logs | "What's the state of the device's interfaces?" |
| Flap | Flap rate (per 2 minutes) · Flap history (the table you built above, if you did the table stretch goal) | "Which interface is flapping and how badly?" |
Save the dashboard. Click between the tabs and check:
- Overview shows the four stat panels (Devices · Interfaces · Firing alerts · Log lines).
- Interfaces shows Interface Admin State · Interface Operational Status · Interface Traffic · Interface Logs.
- Flap shows your Flap rate panel (and Flap history if you also did the table stretch goal).
Drive a flap (nobs packt flap-interface --device srl1 --interface ethernet-1/1) and click into the Flap tab — the view is exactly what an on-call would open on a PeerInterfaceFlapping page.
If a panel ended up in the wrong tab, drag it between tabs while in Edit mode. The provisioned YAML resets the layout on nobs packt restart grafana, so don't worry about breaking anything permanently.
Stop and notice. Tabs change the layout, not the queries. Overview answers “is anything wrong?” while Flap answers “which interface is flapping?”
Part 3 — swap in a real LLM¶
Part 3 used an offline template for the RCA summary. This optional section sends the same facts to an OpenAI or Anthropic model so you can compare the summaries. You need an API key, and your provider may charge for the call.
6. (Optional) Swap to a real LLM provider for the narrative¶
The workflow still uses fixed rules to choose proceed or skip. The model cannot change that result. It only writes a short root-cause analysis (RCA) summary beside a proceed decision. Skip this section if you do not have a key; the rest of the workshop does not depend on it.
Going further — three common gotchas when wiring up a real OpenAI or Anthropic key
ChatGPT Plus and the OpenAI API are billed separately. A ChatGPT subscription does not include API credit. Check your API billing if the first call returns 429 Too Many Requests.
AI_RCA_MODEL must name a model available to your API account. A typo or unavailable model usually produces a 4xx error. Check this value first if Loki shows AI RCA call failed.
After any .env edit, run nobs packt up. A plain container restart keeps its old environment. If you see 401 Unauthorized, use this check to confirm the container received the new key. Compare tail= with the final four characters in .env:
docker compose --project-name packt exec prefect-flows \
  python3 -c "import os; k=os.environ.get('OPENAI_API_KEY',''); print(f'len={len(k)} head={k[:7]} tail={k[-4:]}')"
If they don't match, the container is stale — re-run nobs packt up.
Slow model calls may exceed the workshop's 60-second timeout. If Loki shows ReadTimeout, choose a faster model available to your account and try again.
Step 1 · Swap the provider and key in .env¶
Edit workshops/packt/.env — ENABLE_AI_RCA=true stays as-is from Setup; you're only swapping the provider and adding a key:
AI_RCA_PROVIDER=openai          # or anthropic
AI_RCA_MODEL=gpt-4o-mini        # or claude-haiku-4-5-20251001
OPENAI_API_KEY=sk-...           # or ANTHROPIC_API_KEY=sk-ant-...
Then reload the workflow container so the new env takes effect (a plain docker compose restart won't — see the gotchas fold above for why):
Step 2 · Trigger a fresh cycle and read the new narrative¶
The first command starts a fresh workflow run without waiting for Alertmanager to resend the alert. The second prints the latest AI summary for that peer.
Compare the new summary with the demo template. A model may:
- explain what the raw values might mean;
- suggest useful checks; and
- say when its conclusion is uncertain.
The fixed-rule decision is unchanged. Only the written summary is different.
Read the narrative in its rendered shape
The query above shows each JSON field on its own row — handy for inspecting structure, but hard on the eyes for prose. To render message with its markdown headers and bullets intact, swap to:
The line_format directive replaces the rendered log line with just the unescaped message value (the | json parser has already turned the \n escapes into real newlines). Turn on Wrap lines in the Grafana Logs view toolbar so the multi-line narrative wraps instead of scrolling sideways.
Prefer the terminal? Same data, rendered as Markdown:
Most-recent narrative for that device/peer pair. Both args are optional (omit to see the latest record across the lab); add --last 3 to compare several recent runs side by side, --minutes 180 to widen the lookback window.
What the demo AI RCA narrative actually contains
With AI_RCA_PROVIDER=demo, the workshop fills three sections from the same facts used by the fixed rules. Here is the summary for the broken peer:
AI RCA:
(demo narrative — set AI_RCA_PROVIDER=openai|anthropic with an API key
for a real model response.)

## Most likely cause
SoT expects peer 10.1.99.2 on srl1 to be established, with intent reason 'ip-mismatch-demo',
but oper_state=5 (active), admin_state=1 (enable), received_routes=0.

## Immediate actions
- Inspect reachability and timers between srl1 and 10.1.99.2

## What to verify next
- Tail Loki for device=srl1 around the alert window for BGP state transitions
- Check whether the SoT reason 'ip-mismatch-demo' matches a known fault class
- Compare received_routes=0 against expected_prefixes_received in the SoT
This lands in Loki as one log line with these labels:
ai_rca=true
device=srl1
peer_address=10.1.99.2
source=prefect
workflow=packt_quarantine_bgp
severity=info
The template uses the same intended state, metric values, and prefix count as the fixed rules. A real provider receives those same facts and writes its own response. The ai_rca="true" label separates summaries from decision=... records in Loki.
The important boundary is unchanged: fixed rules make the decision, while AI writes the summary. Part 3, step 4 §C explains why.
Done experimenting? Revert to the offline demo provider
Two-step revert. In workshops/packt/.env:
Then reload the container so the new env takes effect (a plain docker compose restart won't pick up .env changes):
The workflow keeps writing AI RCA annotations, but they're templated again — no API calls, no cost. (Leave your API key in .env; it's ignored when the provider is demo.) If you'd rather turn the step off entirely, set ENABLE_AI_RCA=false instead.
Part 3 — deep dives¶
Optional deep dives¶
Each fold below is an independent optional exercise. You can run all four paths, inspect a run in Prefect, or start the workflow directly.
Walk all four paths at once with try-it --auto
The command below sends four example alerts in about 30 seconds so you can see every result together:
You should see four ✓ rows print:
╭─── Path 1 - Actionable / mismatch → proceed ───╮
   ✓ replayed firing payload for srl1 → 10.1.99.2
   ✓ quarantine flow decided 'proceed' for the actionable mismatch

╭─── Path 2 - In-maintenance → skip ───╮
   ✓ srl1.maintenance = True
   ✓ replayed firing payload for srl1 → 10.1.99.2
   ✓ quarantine flow saw maintenance=true and skipped

╭─── Path 3 - Healthy peer → skip ───╮
   ✓ replayed firing payload for srl1 → 10.1.2.2
   ✓ quarantine flow decided 'skip' for healthy peer

╭─── Path 4 - Resolved → audit ───╮
   ✓ replayed resolved payload for srl1 → 10.1.99.2
   ✓ resolved_bgp_flow ran and annotated 'resolved'
Each path sends alert details to the webhook and waits for its Loki record. Four ✓ rows means all four paths completed.
Tour the Prefect UI
Everything you've seen in this part has happened through a Prefect workflow. Prefect's UI lets you look at the workflow from a different angle — task graph, per-task logs, run history. The Loki audit trail is the record; the Prefect UI is the workshop.
Open Prefect at http://localhost:4200/runs. If a "Join the Prefect Community" pop-up appears, click Skip to dismiss it — it's a sign-up prompt, unrelated to the lab. Sort by Start Time (newest first) and click the most recent quarantine_bgp | … flow run.
You'll see:
- Child runs — three rows under the main run:
evidence,policy, andaction. Click one to see the tasks inside it. - Per-task logs — every line the workflow printed, indexed by task. Same content as
nobs packt logs prefect-flows, but searchable per task. - Tags — labels on each task like
device:srl1,peer_address:10.1.99.2,action:quarantine. These are what an operator filters on to find "every run that touched this peer."
Trigger the workflow directly without an alert
You can start the workflow from the CLI without waiting for Alertmanager. This is useful while testing a change.
The workshop wrapper is:
The wrapper sends the same alert details to Prefect, waits for the new run, and displays the result. Here is the raw Prefect command for reference:
docker compose --project-name packt exec prefect-flows \
  prefect deployment run alert-receiver/alert-receiver \
  --param alertname=BgpSessionNotUp \
  --param status=firing \
  --param 'alert_group={"alerts":[{"labels":{"device":"srl1","peer_address":"10.1.99.2","afi_safi_name":"ipv4-unicast"}}],"groupLabels":{"alertname":"BgpSessionNotUp"},"status":"firing"}'
Same workflow, same decision logic, no alert. To exercise the resolved-bgp branch instead of quarantine, use cycle --status resolved.
Flap without the BGP cascade
nobs packt flap-interface --device srl1 --interface ethernet-1/1 causes a full cascade — the interface flap drags the BGP session down with it, which fires BgpSessionNotUp and runs the workflow. If you only want to exercise the PeerInterfaceFlapping alert (the Loki-rule one from Part 2) without touching BGP, pass --no-cascade:
BGP stays up, BgpSessionNotUp stays clean, and the workflow never fires. Useful when you want to exercise the Loki alert path in isolation.
What the workflow actually looks like in Python
The quarantine_bgp_flow you've been walking is a Python function. The whole thing is short enough to read end-to-end:
@flow(log_prints=True, flow_run_name="quarantine_bgp | {device}:{peer_address}")
def quarantine_bgp_flow(device, peer_address, ...):
    ev = evidence_flow(device=device, peer_address=peer_address, ...)
    decision = policy_flow(device=device, peer_address=peer_address, ev=ev)
    outcome = action_flow(device=device, peer_address=peer_address, decision=decision, ev=ev, ...)
    return {...}
Three calls, one per block of the cycle you walked across Phases 2–4. Each block is a flow of its own with its own tasks, which is why evidence, policy and action appear as separate rows in the Prefect UI and in nobs packt cycle. The @flow decorator on top is what gives this a UI, retries, per-task logs, and a queryable record. "Automation" here is a Python function with decorators on top.
Full source: workshops/packt/automation/flows.py.
Chain another workflow when this one completes
Prefect can also fire a second workflow whenever this one completes — useful for hooking in notifications, opening tickets, or kicking off a follow-up runbook. The pattern is called a Prefect Automation ("when X happens, do Y").
Part 3 — stretch goals¶
Stretch goals (optional — pick one if you have time)¶
-
Tail the Prefect flow logs in real time. Watch a flow run from the inside, line-by-line, so you can correlate every decision in the audit-record trail with the task that produced it.
Solution — how to tail, plus what you'll see in the log stream
Run
nobs packt logs prefect-flowsin one terminal, then re-runnobs packt try-it --autoin another.Each
try-it --autocycle produces a burst of log lines, grouped by the three blocks. For aproceedpath (trimmed):Flow run 'evidence | srl1:10.1.99.2' - Beginning subflow run Task run 'fetch_sot[srl1:10.1.99.2]' - 🔎 [evidence] SoT gate for srl1:10.1.99.2 (ipv4-unicast) Task run 'fetch_metrics[srl1:10.1.99.2]' - 🔎 [evidence] BGP metrics snapshot for srl1:10.1.99.2 Task run 'fetch_logs[srl1:10.1.99.2]' - 🔎 [evidence] last 30m of logs for srl1:10.1.99.2 Task run 'assemble_evidence[srl1:10.1.99.2]' - ✅ [evidence] sot.found=True maintenance=False intended=True expected_state=established reason='ip-mismatch-demo' Task run 'assemble_evidence[srl1:10.1.99.2]' - metrics={'admin_state': 1.0, 'oper_state': 5.0, 'received_routes': 0.0, ...} Task run 'assemble_evidence[srl1:10.1.99.2]' - logs collected: 50 lines Flow run 'policy | srl1:10.1.99.2' - Beginning subflow run Task run 'evaluate_sot_gate[srl1:10.1.99.2]' - 🧠 [policy] stage1 SoT-only → proceed (SoT expects up; metrics not provided (collect evidence)) Task run 'evaluate_metrics_gate[srl1:10.1.99.2]' - 🧠 [policy] stage2 SoT+metrics → proceed (SoT expects peer up, but metrics show mismatch) Task run 'annotate_decision[srl1:10.1.99.2]' - 📝 [annotate] decision=proceed reason=SoT expects peer up, but metrics show mismatch Flow run 'action | srl1:10.1.99.2' - Beginning subflow run Task run 'ai_rca[srl1:10.1.99.2]' - 🤖 [ai_rca] running (gated by ENABLE_AI_RCA) Task run 'quarantine[srl1:10.1.99.2]' - 🔕 [quarantine] silencing srl1:10.1.99.2 for 20m Task run 'quarantine[srl1:10.1.99.2]' - ✅ [quarantine] silence id=d9419759-0b0a-40ce-8bda-21e6298b0bb3The
[evidence]lines show the exact SoT + metric values the policy will see. The[policy]lines show which stage answered and why — on a maintenance run,evaluate_metrics_gateis absent because stage 1 already returnedskip. The[annotate]line carries the samedecisionandreasonyou find in Loki under{source="prefect"}. Tailing the logs is the fastest debug loop when the flow returns an unexpected decision — every intermediate value is visible without a single LogQL query. -
Compare evidence between a healthy peer and a broken one. Both peers share the same SoT intent, but the policy fires
proceedon one andskipon the other. Find the field that drives the difference.Solution — commands to run and what differs between the two
Run both:
nobs packt evidence srl1 10.1.2.2   # a healthy peer
nobs packt evidence srl1 10.1.99.2  # a broken one
Both peers share the same intent in the SoT (
expected_state: established) — the SoT can't tell which one is broken on its own. What separates them is reality, in the metrics:Row Healthy 10.1.2.2Broken 10.1.99.2SoT expected_stateestablishedestablished← sameSoT reasonempty ip-mismatch-demoMetric admin_state1 (enable)1 (enable)← sameMetric oper_state1 (established)5 (active)Metric received_routes100Policy hint skip — peer matches SoT intentproceed — SoT vs metrics mismatchThe policy fires
proceedwhenexpected_state=establishedANDoper_state ≠ 1. Both peers have the same SoT intent — the gap between intent and reality is what the policy keys on. -
Toggle maintenance on srl2 instead of srl1. The maintenance-skip path isn't hard-coded to a specific device. Confirm it by flipping maintenance on srl2 instead and verifying the skip swapped devices.
Solution — commands + verify in Loki that the skip swapped device
nobs packt try-it --autoonly walks srl1 paths, so it won't exercise srl2. Usecycle --triggerpointed at srl2's broken peer instead:The
cyclecommand renders the fresh state once the flow run lands — you should seedecision=skipin the Most-recent-decision panel with the reason"device under maintenance". To confirm in Loki directly:Same record. The
messageis"device under maintenance"— same reason the policy gave for srl1 earlier, only the subject changed.The rule works for either device. It looks up whichever device the alert names, so marking that device as under maintenance changes its result to
skip.Don't forget
nobs packt maintenance --device srl2 --clearafterwards (or runnobs packt reset— it clears both devices). -
Watch a path's audit records in Loki directly. Every Prefect decision lands as a structured JSON record in Loki. Tail them live to see the audit trail being written as you trigger paths.
Solution — LogQL query + the audit-trail shape
In Grafana Explore on the Loki datasource, paste:
Each record has this shape (Grafana parses the JSON inline, so every field renders right under the row):
{
  "timestamp": "...",
  "severity": "info",
  "message": "SoT expects peer up, but metrics show mismatch",
  "labels": {
    "decision": "proceed",
    "device": "srl1",
    "peer_address": "10.1.99.2",
    "source": "prefect",
    "workflow": "packt_quarantine_bgp"
  }
}
Add
| decision="proceed"(ordecision="skip"/decision="resolved") to filter to one path. Triggering a flap or runningnobs packt try-it --autoin another tab produces fresh annotations in real time — flip the time picker's Live mode on to watch them stream in.Step 5's unguided LogQL query (
sum by (decision) (count_over_time({source="prefect"}[1h]))) rolls these annotations up bydecisionlabel — the same audit-trail data, just aggregated. -
Swap the AI RCA provider. Compare the templated demo provider's RCA narrative against a real LLM's. What does the LLM add that the template can't?
Solution — how to switch providers + guidance on the comparison
If you have an OpenAI or Anthropic key, set
AI_RCA_PROVIDER=openai(oranthropic) inworkshops/packt/.envalong with the matchingAI_RCA_MODELandOPENAI_API_KEY/ANTHROPIC_API_KEY. Then runnobs packt upto recreate the flow container against the new env (a plaindocker compose restartwon't pick the values up — see the Going further — three common gotchas fold under Step 1 above for the full why).Trigger a quarantine path so the workflow runs end-to-end with AI RCA on:
Path 1 (firing → quarantine on
srl1:10.1.99.2) lands ondecision=proceed, which is the only decision that invokes AI RCA — so the new narrative lands in Loki underai_rca="true". (Paths that resolve toskipwrite a brief annotation instead, explaining why the LLM was not run — sameai_rca="true"label.) Read it straight from the terminal — same data the Loki query in Step 3 returned, rendered as Markdown in a Rich panel:Add
--last 3to compare the most recent runs side by side — useful right after a provider swap to see the same evidence rendered by two different models.The demo provider produces a templated narrative — it stitches evidence-bundle fields into the same paragraph structure every time:
## Most likely cause
SoT expects peer 10.1.99.2 on srl1 to be established, with intent reason
'ip-mismatch-demo', but oper_state=5 (active), admin_state=1 (enable),
received_routes=0.
A real LLM (OpenAI or Anthropic) typically adds:
- Domain inference — translates the raw numbers into operational hypotheses ("
oper_state=5withreceived_routes=0is consistent with a TCP-level reachability failure or AS-number mismatch — the FSM is trying but not authenticating"). - Wider context — references the BGP state machine, common causes for "stuck in active", suggested next debug steps (traceroute, configured remote-as check).
- Calibrated uncertainty — phrases like "most likely" or "consistent with" rather than confident pronouncements.
The template can only fill known fields. A model may add a more useful explanation, but its wording can vary and the provider may charge for each call. In both cases, fixed rules still decide whether to act.
- Domain inference — translates the raw numbers into operational hypotheses ("
Advanced — the 02:14 page¶
This optional capstone combines the earlier lessons into one incident. Complete Parts 1–3 first; this section assumes you already know the commands and query basics.
What you'll do here¶
It is 02:14 and an alert wakes you. You will check it with PromQL and LogQL, watch a link failure cause later symptoms, pause automated action with the maintenance flag, reset the lab, and write a short runbook entry. Allow 60 to 90 minutes.
Setup check¶
Confirm the command is available:
You should see options for --device, --primary-interface, --backup-interface, --duration, and --kind (default link-failover). If incident isn't a recognised subcommand, pull and re-run.
Reset the lab and confirm the stack is healthy:
reset restores the lab's starting data, clears maintenance flags, and expires workshop silences. It is safe to run more than once. Wait until every status row says ok.
Two browser tabs ready:
- Workshop Home at http://localhost:3000/d/workshop-home — situational awareness, alerts table, recent events feed.
- Workshop Lab 2026 at http://localhost:3000/d/dfb5dpyjbh2wwa — the dashboard you'll lean on in Act 4 as the incident unfolds.
Ensure AI RCA analysis is enabled. Open the workshop's .env file at workshops/packt/.env and flip these two lines:
Don't forget to reload the workflow after enabling AI RCA:
Also open a scratch text file for the runbook exercise at the end.
The exercises¶
Act 1 — The page¶
PAGED 02:14
BgpSessionNotUp on srl1 — peer 10.1.99.2 not reaching Established
last seen Established: ~3 minutes ago
You're awake. The dashboard is your only friend.
10.1.99.2 is the deliberately broken peer from Part 1. First, confirm that its alert is still firing:
You should see two BgpSessionNotUp alerts and two InterfaceAdminUpOperDown alerts. Investigate the srl1 → 10.1.99.2 row. The other three are known lab faults.
Act 2 — Triage with PromQL and LogQL¶
Use each query to narrow the problem: first the device, then its interfaces, then the BGP peer, and finally its logs.
Is the device itself unhealthy? Check CPU and memory in the prometheus datasource:
Both should be in their normal range. Conclusion: high CPU or memory use is not causing this alert.
Are interfaces flapping? Check the operational state:
Most interfaces read 1 (up). ethernet-1/11 reads 2 (down), but that is the known broken interface from Part 1. Conclusion: there is no new interface failure to explain this alert.
Is the peer reachable at the BGP layer? Check intent and reality on this specific peer:
Admin reads 1: the peer is enabled. Oper reads 5: BGP is active and retrying. Conclusion: the peer should be up, but the session is not establishing.
Is there a log line that explains why? Bridge to Loki — same labels, different datasource:
The matching lines show connection failures and retries for this peer. The metrics showed what was wrong; the logs add the likely reason.
Stop and notice. Four small checks narrowed one alert to a BGP problem on one peer. Each check ruled out a wider cause before you moved deeper.
Want to see what the automation already thinks about this alert?
The workflow has been running on this alert in the background — it heard the same BgpSessionNotUp page you did, walked its own version of the triage tree, and wrote a narrative to Loki. Read it from the terminal:
Compare the summary with your own conclusion. Note anything it caught or missed. If it says "AI RCA disabled...", check the setup above. You may also need to wait for the workflow to finish and try again.
Act 3 — Diagnose: drive the cascade and walk the shape¶
Now start a separate incident on the same device. It begins with an interface flap, moves traffic to a backup link, and later increases latency:
The command returns immediately and prints one ID for each stage. Open Workshop Lab 2026 and run the next three queries in Prometheus Explore as the incident develops. Keep Workshop Home open to watch Recent events.
The first thing that catches your eye — primary degrading. The interface starts flipping:
Switch to Time series. ethernet-1/10 alternates between 1 (up) and 0 (down): about 60 seconds up, then 30 seconds down. The source="incident-cascade" filter hides the lab's unrelated interface data.
Stop and notice. This scripted incident uses 0 and 1, while earlier device data used 1 and 2. Its source="incident-cascade" label keeps the two sets separate. It also does not emit bgp_oper_state, so it does not start the existing BGP alert.
Did failover work?
Empty for the first ~60 seconds — you'll see "no data" or a flat panel. Once the primary drops to 0 for the first time, the metric appears and ramps from around 20% toward 85% over the next two minutes.
Stop and notice. The backup metric appears only after the primary fails. That means failover worked, but the rising value warns that the backup may run out of capacity. “No data” during the first minute is expected.
The symptom your customers feel — latency:
This metric appears after the backup becomes busy. It then rises from about 5 ms toward 150 ms over three minutes.
Stop and notice. Latency is a late symptom. The interface began failing minutes earlier. Reading the timeline from the first change helps you find the cause instead of stopping at the customer-visible symptom.
Why the cascade takes longer than the --duration flag suggests
--duration 3m applies to each signal, not to the whole incident. Later signals wait for earlier conditions, so the full sequence takes longer than three minutes.
Act 4 — Read the dashboards you already have¶
The incident is still running. Read the dashboards you already have; an active incident is not the time to design new panels.
"Your dashboards earned their keep this morning, when you built them in peacetime. Tonight, you just read them."
Open Workshop Lab 2026 and walk the panels you already have.
The Flap rate panel from Part 2. Choose srl1 and Last 15 minutes. The panel stays below its red threshold because this incident emits metrics but no UPDOWN log lines. That quiet panel rules out the kind of log-based flap it was built to detect.
Interface Operational Status and Interface Traffic. These panels show the lab's usual device data. Use Explore with the three Act 3 queries for the incident's source="incident-cascade" metrics.
Workshop Home. The alert table still shows the four known alerts because this incident does not match those rules. Recent events shows the new activity.
Together, the views show the sequence: primary link failure, rising backup use, then latency.
Stop and notice. A panel that stays quiet can still be useful: it tells you this incident is not the condition that panel measures.
Act 5 — Contain: silence the noise with maintenance¶
Mark srl1 as under maintenance so the automated workflow will not act on new alerts while you investigate:
Verify the alert flow's response will now change for this device:
BgpSessionNotUp remains firing because maintenance does not repair the peer. It changes only the response: the workflow reads maintenance=true from Infrahub and chooses skip. Alertmanager normally waits 30 minutes before resending the same alert, so use the tip below if you want to see that result now.
Want to see the skip annotation land now?
Drive a fresh cycle directly, bypassing Alertmanager's repeat_interval:
Within ~15 seconds the four-panel cycle view re-renders with the fresh decision=skip audit record. For the AI narrative side of the same evidence:
Either surface shows the decision=skip / reason=device under maintenance record the workflow just wrote.
Stop and notice. The maintenance flag tells automation that a person is working on the device. The next workflow run reads the new value and leaves the alert alone.
Act 6 — Fix and recover¶
Stop the scripted incident and restore the starting state:
Within about 30 seconds, the incident values stop changing and the usual lab data takes over. reset also clears maintenance flags and workshop silences.
Run nobs packt alerts again. The original BgpSessionNotUp alert still fires because that deliberately broken peer is part of the lab's starting state. The temporary incident and maintenance setting are gone.
Stop and notice. Recovery also has an order: the incident stops, backup use settles, and latency falls. Real recovery may be less tidy, but the same timeline method applies.
Act 7 — Write the runbook stub¶
While the investigation is fresh, write the first few lines of a runbook for the next on-call:
### Runbook — primary uplink degradation cascade

**Symptom on the page:** _________________

**First three queries to run:**
1. _________________
2. _________________
3. _________________

**Containment action:** _________________

**What "fixed" looks like in the dashboard:** _________________
Fill the blanks with the checks and actions that were useful in this exercise.
Then re-read what you wrote.
If a colleague got paged at 2am with this same symptom and you weren't around, would your five lines get them through it?
Stop and notice. A short runbook turns what you learned during one incident into a faster starting point for the next person.
Stretch goals (optional — pick one if you have time)¶
-
Drive the same investigation on srl2. The cascade you just walked was on srl1. Re-run it on srl2 and confirm your runbook stub still applies — if it doesn't, it was either too device-specific or you've found a real shape difference worth writing down.
Solution — command to run + what to expect on srl2
Run
nobs packt incident --device srl2. It produces the same cascade shape on srl2. The pre-existingBgpSessionNotUpalert forsrl2 → 10.1.11.1(the deliberately-broken peer on the SNMP-shape device) was visible in Act 1 already.Act 2's triage queries all work the same way — just change the device label and adjust the peer:
You should see
oper_state=5while Infrahub saysexpected_state=established. If your runbook does not work for srl2, replace any device-specific or collection-specific instructions. -
Predict the customer-impact window. At what point in the cascade would a customer's response-time SLO break? Back the answer with data from Act 3's queries, not feel.
Solution — the math + customer-impact arithmetic
Given the timing you observed (backup utilisation crossing 70% around t=2½ min, latency ramping from there toward 150ms over the next three minutes), linear interpolation on latency:
- At t ≈ 2:30, latency starts at 5 ms.
- At t ≈ 5:30, latency hits 150 ms (3 min of ramp).
latency ≈ 5 + (t − 2:30) × (150 − 5) / 3ms.
For this exercise, suppose the service allows 50 ms of network latency and considers 100 ms a breach.
- 50 ms reached at t ≈ 3:25 (start eating SLO budget — about 55 seconds after the primary's first DOWN edge).
- 100 ms reached at t ≈ 4:30 (SLO breach — about 2 minutes after the primary's first DOWN edge).
By the time latency reaches the example limit, the primary link has already been failing for several minutes. An earlier signal, such as the flap or rising backup use, gives the on-call more time to respond.
-
Compare the investigation arc to the automated path. Contrast the manual investigation you just walked against Part 3's automated flow. Where does each one belong in a real operation?
Solution — command to run + the qualitative comparison
Run
nobs packt try-itfrom Part 3 to exercise the four automated paths. Compare those fixed responses with the questions you asked during the manual investigation.Two different jobs, both useful:
Aspect Investigation (Acts 1–6) Automation ( try-it)When it runs After a page, guided by a person Automatically for each matching alert Latency Minutes per query, hours for the full arc Seconds end-to-end What it produces A diagnosis, a fix, and a runbook update A fixed decision and a record of it Where it excels When you have time and a specific question When alert volume exceeds human attention Where it falls short At 2am with 50 alerts firing simultaneously When the situation is novel — outside the policy's rule set Automation is useful for known cases with agreed rules. A person is still needed for unfamiliar failures, exceptions, and changes to those rules.
What you took away¶
- The primary link failed first; backup pressure and latency followed. Start with the timeline to separate cause from symptom.
- Matching labels let you move from a metric to the related logs without searching again.
- Build dashboards before an incident and update the runbook while the useful details are fresh.
Where to go next¶
The book. Modern Network Observability is the long-form version of everything here — the collectors, the schema design, the alerting philosophy, the automation patterns, with far more depth than three hours allows.
The deeper lab. network-observability-lab is the book's chapter-by-chapter playground: every collector, every variant, real cEOS and SR Linux containers in the loop. Bigger surface area, more RAM, more network-engineering depth. This workshop is the tight on-ramp; that repo is the full trip.
Asking questions after the session. Questions during the session go through Packt's Q&A panel. Afterwards, open an issue on the workshops repo — a broken step, a query that will not run on your machine, or a "why is it done this way" are all fair game, and a question that catches a real gap makes the workshop better for the next room.