Part 2 of 3 · guided demo
Dashboards and alerts
We drive; you watch. Part 3 starts from a clean lab state.
A follow-up from last night's incident asks for a flap-rate panel. We build it on screen, match its thresholds to the alert rule, overlay the firing window, then silence a notification safely. You can follow along in Grafana or simply watch the demo.
You're back from the short break. The team standup is wrapping in the next room. Your senior slides their laptop across with an email open on it.
From: oncall@example.com
Subject: Post-mortem action — flap-rate panel

Yesterday's page was BgpSessionNotUp on srl1, 10.1.99.2.
We could see BGP was wobbly but couldn't see WHY without
scrolling. Standby lost about ten minutes recognising the
flap shape. Need a flap-rate panel on Workshop Lab so the
next page lands with the right view already on screen.
Whoever's free, take it.
Your senior taps the screen. "The alert told us BGP was unstable, but the dashboard did not show the interface flaps that caused it. Let's add the missing view before the next page."
Follow the live demo
The main route is numbered Demo 1 through Demo 5. We drive; you watch. Follow the uncollapsed text to build one panel, trigger one flap, inspect its alert, overlay the firing window, and silence a notification safely.
Second-device testing, implementation details, and troubleshooting are inside collapsed Optional boxes. Part 3 starts from a clean nobs packt reset and does not depend on this panel, but it refers back to the alert states shown in Demo 3 and Demo 5.
A "flap" is an interface bouncing up and down in quick succession. The flap-rate panel counts UPDOWN log events per interface in a rolling window — a number that climbs fast when something is flapping and sits at the floor when it isn't.
An alert rule is a query plus a condition, such as “more than three events in two minutes.” The lab checks it on a schedule and creates an alert when the condition stays true.
We add one panel to Workshop Lab 2026 to answer: is this interface flapping now? The same panel works for either device, and its red line matches the real alert condition. Then we trigger a flap and watch it react.
A dashboard is an operational tool, not wall decor. One dashboard, one story.
Before the live demo
Prepare the lab and open the dashboard before learners begin:
Open Grafana at http://localhost:3000 and navigate to Workshop Lab 2026 (/d/dfb5dpyjbh2wwa).
Optional orientation — what's already on the dashboard?
The existing panels are:
- Health summary row — Devices / Interfaces / Firing alerts / Log lines (5m)
- Interface Admin State and Interface Operational Status — what intent says and what reality says
- Interface Traffic — bandwidth per interface, drawn from
rate(interface_in_octets[...]) - Interface Logs — raw log lines for
$device
At the top, the Device dropdown controls $device. Grafana calls this a dashboard variable: each panel uses the selected value instead of hard-coding one device. Toggle between srl1 and srl2 and watch the panels update.
Your senior glances at the screen. "Notice the dashboard didn't break when you toggled. That's the variable doing its job. Every panel here uses
$device— same panel, two subjects."
Saved changes last for this workshop session. nobs packt restart grafana restores the original dashboard, so treat it as a scratchpad.
Start the live demo
You're adding a flap rate panel: the number of UPDOWN log events per interface during the last two minutes. Its thresholds match the PeerInterfaceFlapping alert rule.
Demo 1 · Build the flap-rate panel
Write the query
"Count UPDOWN log events for each interface over two minutes. Use the dashboard variable so the panel works for either device."
Open Edit (top right) → add a panel → choose loki. We use Loki because this panel counts log lines; it does not read a stored Prometheus metric.
The query box defaults to Builder mode — a click-to-build form with Label filters and Operations. To paste a raw LogQL query, toggle to Code mode using the Builder | Code switch on the right side of the query toolbar.
In the Loki query box (now in Code mode), paste:
Read the query from the inside out:
{device="$device", vendor_facility_process="UPDOWN"}keeps UPDOWN logs for the selected device.count_over_time(...[2m])counts those logs during the last two minutes.sum by (interface)gives each interface its own line.
Click Run query. Before you trigger a flap, the panel is usually empty. You may briefly see ethernet-1/11 at 1; that interface is broken by design and writes about one event every two minutes. Healthy interfaces do not appear because there is nothing to count.
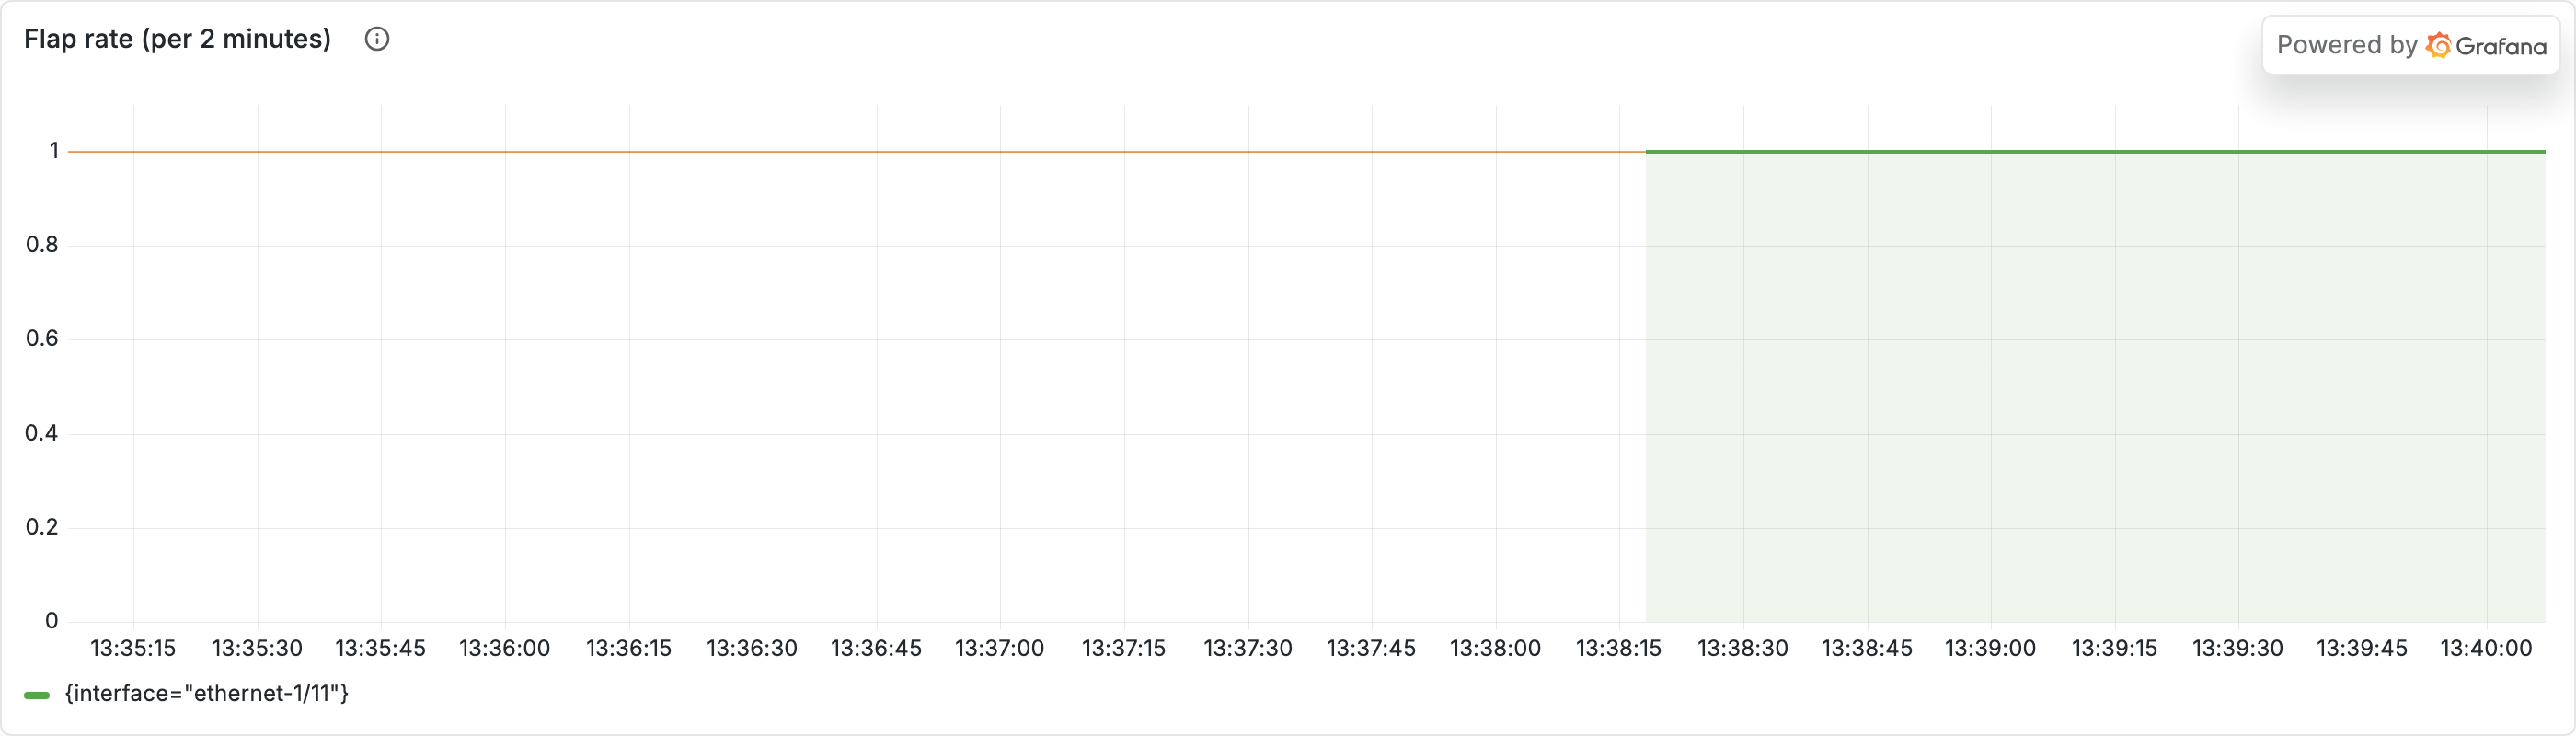
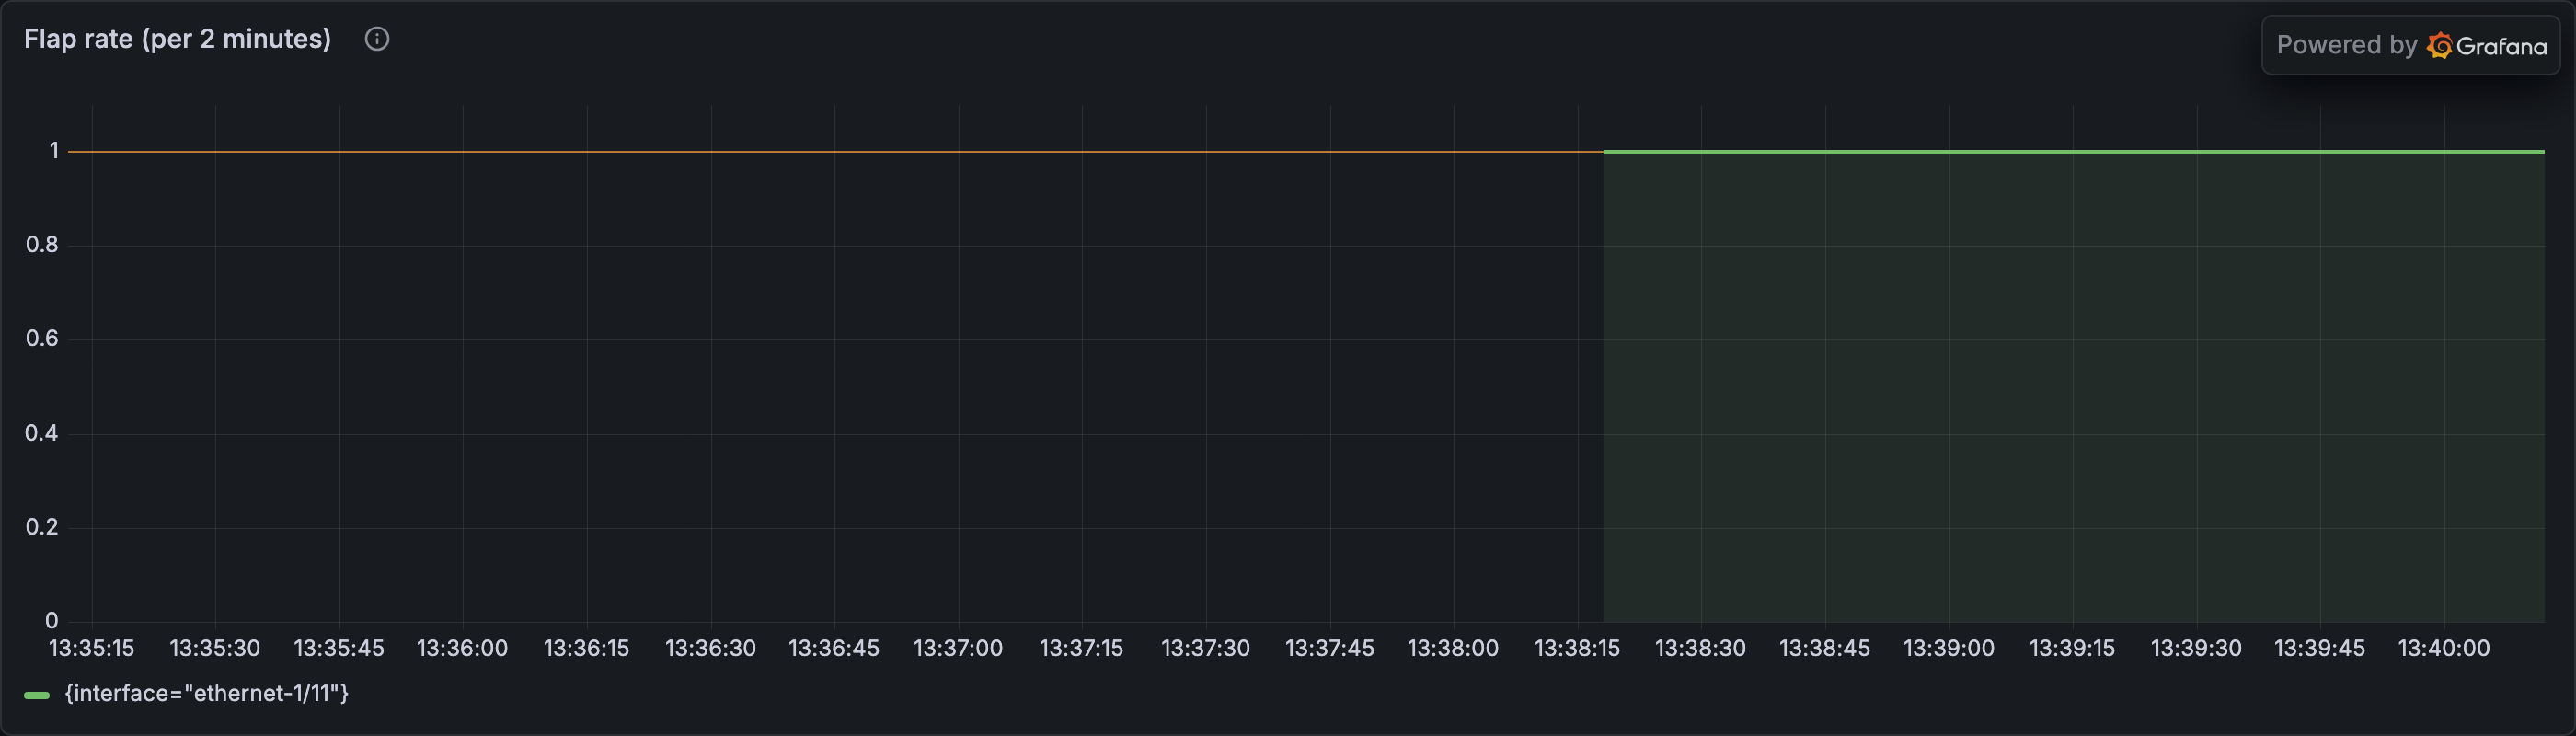
ethernet-1/11 at 1 (the only interface that's actually flapping at rest, because it's broken by design). The other peer interfaces are silent. Anything else here means a real flap is in progress.Optional troubleshooting — empty panel?
Two reasons the panel might look empty:
- The
Devicedropdown above the dashboard isn't set to a real device. Toggle it tosrl1orsrl2. - The broken-interface log emitter fires only every ~2 minutes — the panel goes back to empty between events. Wait a minute or two for the next one to land.
Set thresholds that match reality
"Now thresholds. The PeerInterfaceFlapping alert fires when count_over_time over 2 minutes exceeds 3. Match that — when the threshold line moves, the alert is right behind it."
The PeerInterfaceFlapping alert fires when count_over_time({vendor_facility_process="UPDOWN"}[2m]) > 3. Mirror that on the panel so the threshold line is the alert condition:
In the right-hand options pane, scroll down to find the Thresholds section — it's usually about eight sections down, past Panel options, Tooltip, Legend, Axis, and Graph styles. Set:
| Color | Value | What it means |
|---|---|---|
 Green Green |
base (default — keep it) | "everything's quiet" |
 Orange Orange |
2 |
"early heads-up — activity above the always-broken ethernet-1/11 baseline (which sits at 1)" |
 Red Red |
3 |
"alert firing — the PeerInterfaceFlapping rule's > 3 condition has been crossed" |
Under Graph styles → Show thresholds, choose As lines. You should see orange at 2 and red at 3. Orange is an early warning above the broken interface's usual value of 1. Crossing red means the alert condition is true; the rule still waits 30 seconds before firing.
Your senior glances over. "Thresholds matching the alert rule? Good. When the line crosses the orange one, an interface just logged a state change — that's your early heads-up. When it crosses the red one, the alert is firing and someone's pager goes off. The panel makes both moments visible without a separate alerts pane."
Demo 2 · Trigger a flap and watch the panel
"OK. Panel's there. Doesn't mean anything until we see it react. Drive a flap."
In a terminal:
This starts a four-minute scripted incident. The interface alternates between 30 seconds up and 60 seconds down. While it is down, the lab writes about one UPDOWN event every two seconds. Set the dashboard's Device dropdown to srl1.
Turn on auto-refresh so the panel updates live
By default the dashboard only re-queries when you reload it. To watch the flap climb in real time, click the circular arrow icon at the top-right of the dashboard (next to the time-range picker) and pick 5s from the dropdown. The panel will re-query every 5 seconds — fast enough to catch the cascade as it unfolds, slow enough not to hammer the backends. Set it back to Off when you're done.
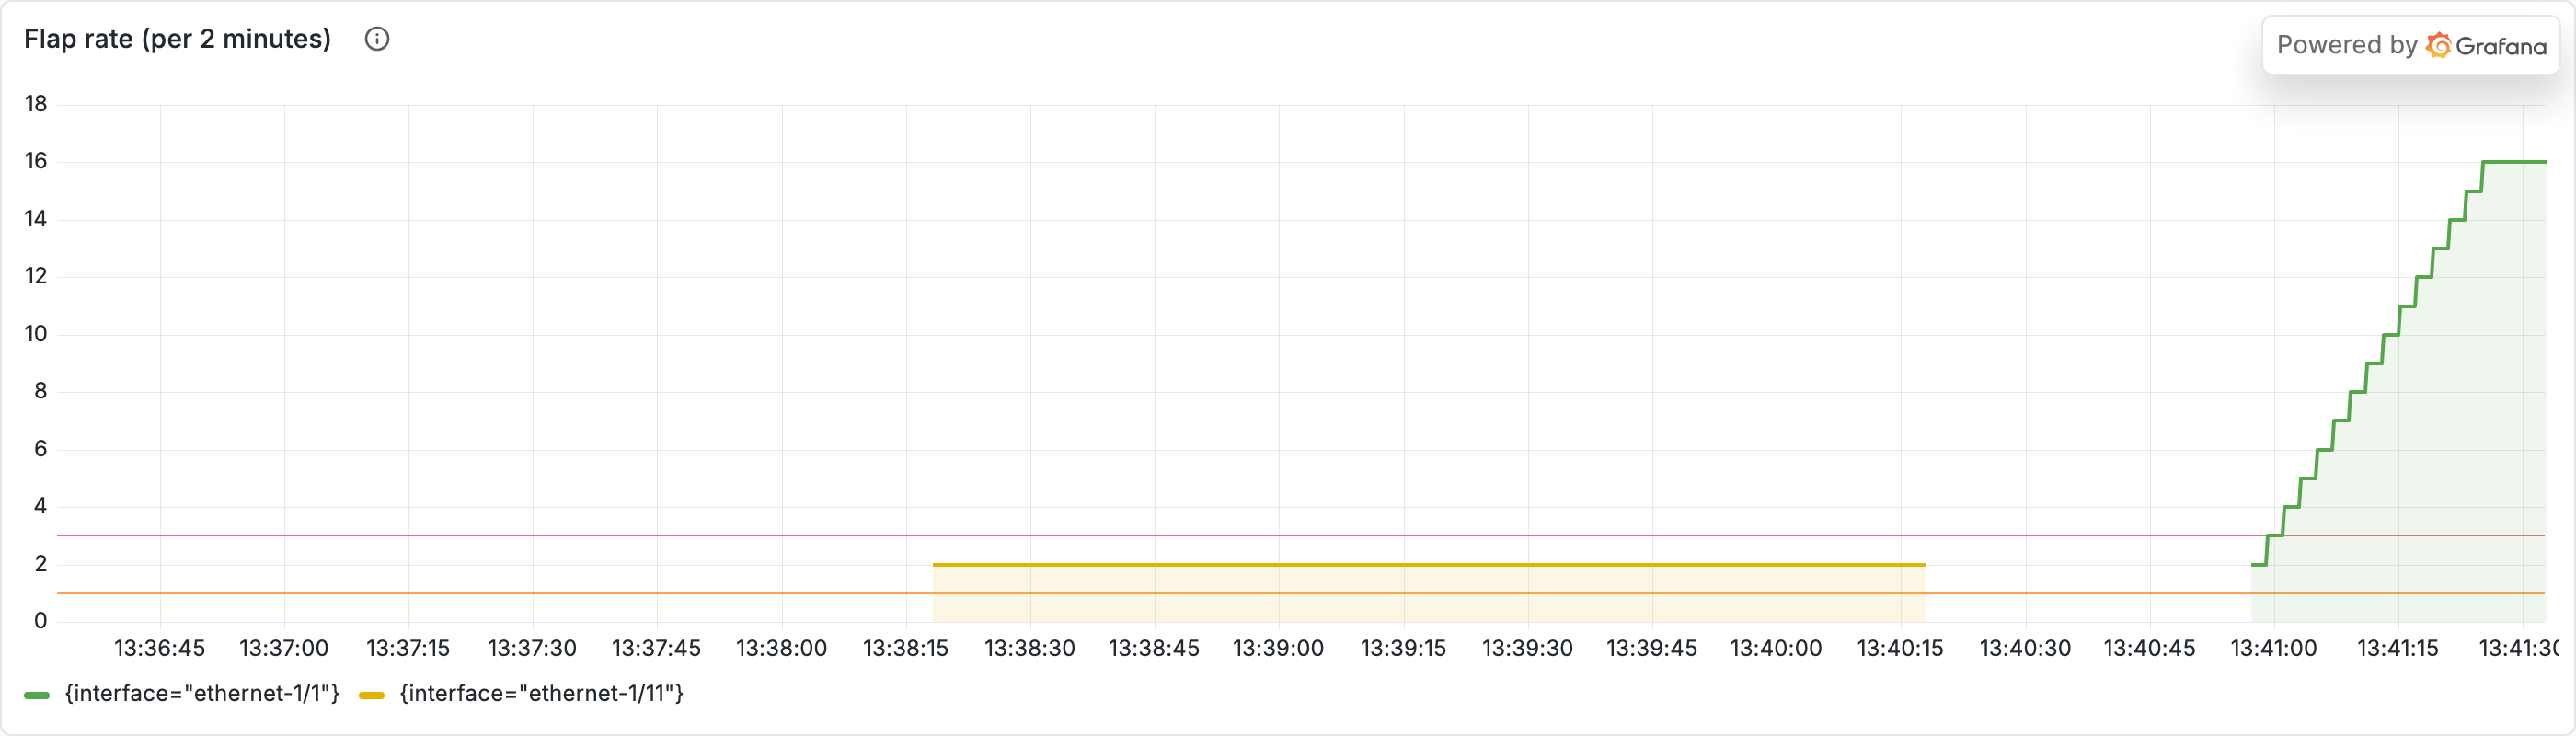
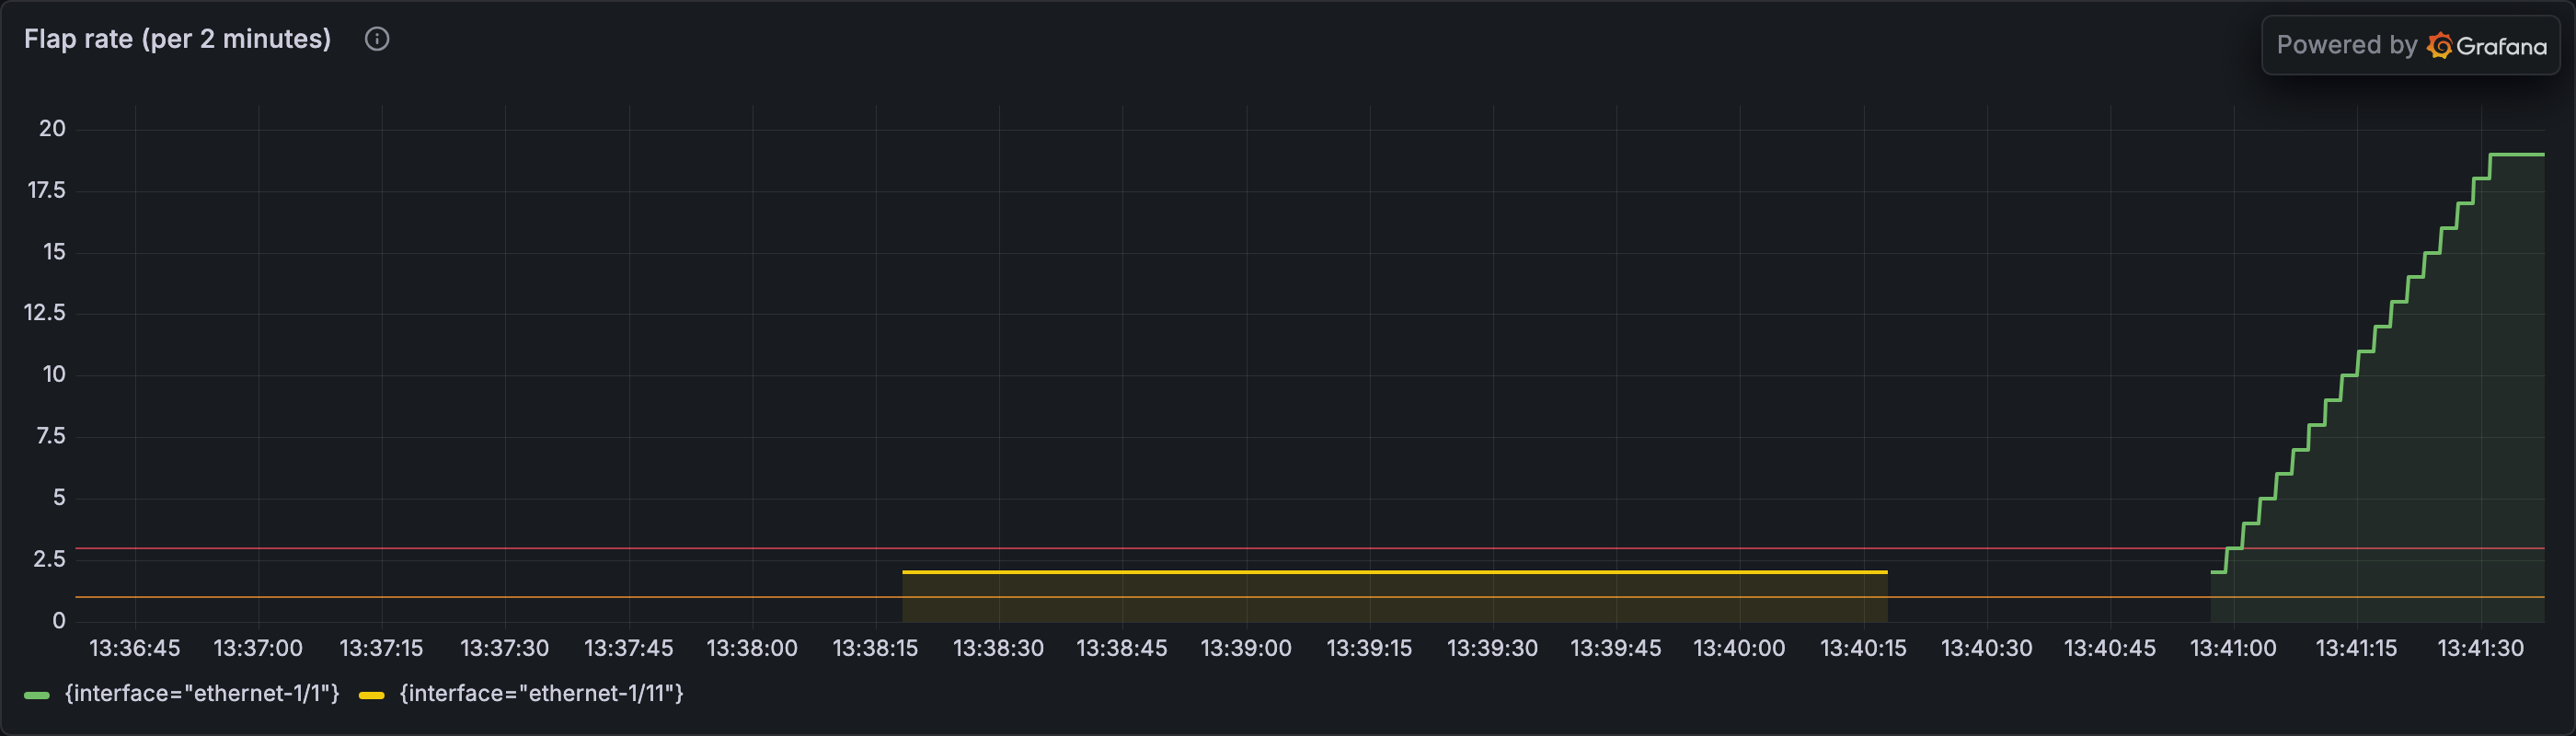
ethernet-1/1, climbing fast past the orange threshold (2) and through the red threshold (3) on its way to 16+. You may also see a faint yellow series line for ethernet-1/11 at 1–2 (that's the Grafana-assigned color for that interface, not a threshold) — the broken-interface log emitter fires at random intervals (roughly once every 2 minutes), so it isn't always inside the 2-minute window the panel is counting. Either way, the flapped interface is the obvious anomaly against an otherwise quiet panel.What you should see:
- The first 45 seconds are quiet because the interface starts up.
- Around one minute,
ethernet-1/1appears and quickly crosses both thresholds. - The count may flatten briefly while the interface is up, then climb again during the next down period.
- It does not fall immediately after each down period because the panel always counts the previous two minutes.
Your senior taps the screen. "Watch the orange line — that's the early heads-up, an interface just logged a state change. Watch the red line — that's where someone's pager goes off because the alert rule fired. The panel makes both moments visible without a separate alerts pane."
Stop and notice. This is the same query pattern that drives the PeerInterfaceFlapping alert you'll inspect next. The panel isn't decoration — it's a visual representation of the rule that's about to fire. When the on-call gets paged, this panel is what they look at first.
Optional proof — use the same panel for a second device
"Now the proof that the variable was worth it. Toggle to srl2 and drive a flap there. No editing the panel — the dashboard does the work."
Toggle the Device dropdown to srl2. The flap-rate panel re-queries and now shows srl2's steady-state — mostly silent, with at most a single tick from the always-broken ethernet-1/11 every two minutes. Same as srl1 before you triggered its flap.
Trigger:
Watch the spike land on srl2's ethernet-1/10 line — same ramp shape, same threshold crossings, same recovery — without you editing the query.
Stop and notice. One panel, two devices. That's what the dashboard variable bought you. If you'd hard-coded device="srl1" in the query, you'd need a duplicate panel for every device you ever add — and one to maintain per device when the schema changes.
The panel works for both devices because Part 1 made their different gNMI and SNMP names consistent before storage. Revisit that before-and-after comparison if you want a refresher.
Your senior nods at the screen. "That's the panel. Six hours from now when somebody on the rotation gets paged on a similar shape, this view is on screen the moment they open the dashboard. Ten minutes saved off the next triage. That's the work."
Walk the alert lifecycle
The panel showed when the condition became serious. Now follow the actual alert: when did it fire, where can you see it, and how do you mute it safely?
We use Alertmanager and Grafana to follow four states: condition matched → alert firing → notification silenced → problem resolved.
Heads-up: this walk is foundational for Part 3, which is hands-on. Watch it closely even if you are not following along in your own Grafana — Part 3 assumes you have seen
firing → suppressed → resolvedhappen once.
Demo 3 · Inspect the firing alert
The PeerInterfaceFlapping rule runs the same query as the panel and adds > 3. The fold shows the complete file; for now, focus on when the state changes.
What's an alert rule? — YAML anatomy and where to see it
An alert rule says what to watch, when to fire, and what information to attach:
expris the query and condition.forsays how long the condition must remain true, which filters out brief blips.- Labels identify and route the alert.
- Annotations are the human-readable summary and description sent with it.
Here's the PeerInterfaceFlapping rule the thresholds you set on the panel are mirroring:
- alert: PeerInterfaceFlapping
  expr: sum by(device, interface) (count_over_time({vendor_facility_process="UPDOWN"}[2m])) > 3
  for: 30s
  labels:
    severity: critical
    source: loki
    environment: network-observability-lab
    device: '{{ $labels.device }}'
    interface: '{{ $labels.interface }}'
  annotations:
    summary: "[NET] Flapping interface in {{ $labels.device }}/{{ $labels.interface }}"
    description: "The interface {{ $labels.device }}/{{ $labels.interface }} is flapping"
Here, expr is the panel query plus > 3. The condition must then remain true for 30 seconds. device and interface identify what is broken; summary and description explain it to the person receiving the alert.
Where to find it. Loki checks this log-based rule, so it does not appear on Prometheus's /alerts page:
- When firing: see it in Alertmanager, where both log-based and metric-based alerts arrive.
- At any time: read
workshops/packt/loki/rules/alerting_rules.yml.
Part 3 continues beyond Alertmanager: a webhook hands the alert to Prefect, which gathers evidence and decides what to do.
Two transitions to keep in mind as you watch the rule fire:
- Matched is not yet firing. The state is
pendingduring the 30-second wait. It becomesfiringonly if the condition stays true. - Resolved means the condition cleared. The alert then leaves the active list.
You flapped srl1/ethernet-1/1 a moment ago. Once the condition remains true for 30 seconds and a following rule evaluation runs, it becomes firing. Let's confirm.
Optional troubleshooting — alert not visible yet?
Loki evaluates this rule group once per minute. The expression must first cross > 3, remain there for the 30-second for window, and then be seen by a later evaluation. Keep the flap running and refresh Alertmanager after the next evaluation.
Inspect it in Alertmanager
Open http://localhost:9093/#/alerts. Alertmanager collects the firing alerts from both Prometheus and Loki.
What to look at:
- The alerts list — every alert the lab currently holds, grouped by label set. Click any row to expand and see all its labels (
device,interface,severity, …) and annotations (summary,description). - The filter box at the top — paste
alertname="PeerInterfaceFlapping"to scope down. Filters use the same label-matcher syntax as PromQL/LogQL selectors. - The generator URL on an expanded alert — the link back to the rule that fired this alert. For
PeerInterfaceFlappingit points at the Loki ruler's evaluation. - The Silences tab in the top nav — this is where you'll create one in Demo 5.
Demo 4 · Overlay the firing window on the panel
Prometheus exposes alert state as a metric. A firing alert returns a series with value 1 and labels such as alertname, device, and interface:
Grafana can draw that series as an alert marker over the flap-rate panel. Grafana calls this feature an annotation; it is unrelated to the annotations: notification text in an alert-rule file.
Add the marker while the recent flap is still inside the dashboard's time range:
- Click Edit (top-right of the dashboard).
- Open Dashboard options in the right sidebar.
- Find Annotations and click Add annotation query.
-
Set the outer options:
Field Value Name PeerInterfaceFlapping firingColor red Show annotation controls in Above dashboardShow in All panels -
Click Open query editor and set:
Field Value Data source prometheusQuery ALERTS{alertname="PeerInterfaceFlapping", alertstate="firing"}Title {{alertname}}Text {{device}}/{{interface}} -
Click Test annotation query, close the modal, then Save and Exit edit.
The double braces tell Grafana to replace each name with that alert label. The hover text therefore reads like PeerInterfaceFlapping — srl1/ethernet-1/1 instead of showing the template.
Return to the flap-rate panel. A red region now marks the period when the alert was firing, on top of the same line that crossed the threshold. You do not need to trigger another flap. If no marker appears, widen the dashboard time range so it includes the incident from Demo 2.
The payoff. Threshold lines show when the data should trigger an alert. The red region shows when the rule actually did. The on-call can compare the signal and the decision without leaving the panel.
Demo 5 · Silence and restore a notification
What a silence does
A silence tells Alertmanager not to send notifications for alerts with matching labels. It has four pieces:
- Matchers — the labels an alert must have, such as a device and alert name.
- Duration — how long the mute lasts.
- Creator — who created it.
- Comment — why it exists. Always write one in production.
Silencing does not fix the problem or stop the rule. It only mutes notifications for matching alerts. Alertmanager shows them as suppressed until the silence expires.
This distinction matters: silencing isn't fixing. It's saying "we know about this, stop paging us about it for the next N minutes." The rule keeps watching; the page just doesn't fire.
Create a silence by hand
We'll silence one of the always-firing InterfaceAdminUpOperDown alerts. Safe target — silencing it doesn't break anything in the lab, and seeing it flip from firing to suppressed is the whole point of this step.
- Open Alertmanager at http://localhost:9093/#/silences (the Silences tab) → New Silence.
- Add matchers (click + Add matcher for each):
alertname=InterfaceAdminUpOperDowndevice=srl1
- Duration:
5m. - Creator: your name or
workshop. - Comment:
Testing silences in workshop. - Click Confirm.
Return to the Alerts tab. The InterfaceAdminUpOperDown(srl1) row now shows as suppressed, not firing. Click it — labels and annotations are unchanged, but a new silenced_by field carries the silence ID. The same transition is visible from the terminal with nobs packt alerts — same data, two surfaces.
Now flip it back: in Silences, find your silence, click Expire. Refresh Alerts — the row is back to firing.
Close the live demo
"That's the dance the on-call does every time something fires while a known maintenance is in progress. Whoever takes the alert clicks Silence, picks the right matchers, sets a duration, writes a comment. The rule keeps watching, the pager stops yelling, the audit trail shows who silenced what and why."
What you took away
- A dashboard variable such as
$devicelets one panel work for more than one device. - A panel can count matching log lines as well as display Prometheus metrics.
- Panel thresholds should show the same boundary as the alert rule.
- An alert moves from
pendingtofiringonly after its condition remains true for the rule'sforwindow. - A silence changes notification delivery, not the alert condition or the underlying problem.
restart grafanarestores the lab's supplied dashboards, so your edits are temporary.- Descriptions and links help the next person understand what a panel shows and where to investigate next.