Part 3 of 3 · hands-on
Alerts, automation and AI
One alert, four possible paths, and the decisions that still need a person.
An alert fires and a workflow handles it. Follow each step: receive the alert, gather facts, apply fixed rules, and take action. Then mark the device as under maintenance and see why the result changes. An optional AI step writes a root-cause summary, but it never chooses the action.
Late morning. The clock is creeping toward lunch. The flap-rate panel from before the break is still pinned in a tab. You're both finishing coffee when a BgpSessionNotUp alert lands — a real one, on the lab. Your senior glances at the dashboard, then at you.
"Watch what the workflow handles on its own. Then we'll change the facts and see it make a different choice. By the end, you'll know what the automation can do and what still needs a person."
Follow the live path
The live path is numbered Live 1 through Live 5. Run the commands and read the uncollapsed text in those sections. Browser tours, implementation details, and extra query practice are inside collapsed Optional or Curious? boxes; they are not required to complete the story.
The main route stays in the terminal until the final comparison: observe a real alert, gather its evidence, follow a proceed decision, then turn on maintenance and see the same alert return skip.
Before the live session
Prepare the lab before learners begin. The live path starts with nobs packt reset, not with container startup or configuration.
First time spinning up the lab?
If the lab is stopped, start it and wait until every service says ok:
Loki may be the last service to turn green.
If you landed straight on Part 3 without running Quickstart, seed Infrahub once after the stack is ready. Infrahub stores the intended network state that the workflow checks on every alert:
Enable the AI-written summary
RCA means root-cause analysis: a short explanation of the likely cause and what to check next. Enable the offline demo provider now; it needs no API key and costs nothing:
Edit workshops/packt/.env and set:
Then reload the workflow container so the new env takes effect (a plain docker compose restart won't pick up .env changes):
The demo provider fills a template with the facts gathered by the workflow. It does not call an AI service, but it lets you see where an AI-written summary would appear. A proceed decision writes the summary to Loki with ai_rca="true". The Take it home page shows how to use a real provider.
What's a workflow?
A workflow is a set of steps started by an event. Here, Alertmanager sends a new alert to Prefect. Prefect then gathers facts, applies fixed rules, and decides whether to silence the alert.
The handoff at a glance:
   alert fires
        │
        ▼
   Alertmanager
        │
        ▼
   webhook receiver
        │
        ▼
   Prefect workflow
        ├── gather evidence
        ├── make a decision
        └── take or skip action
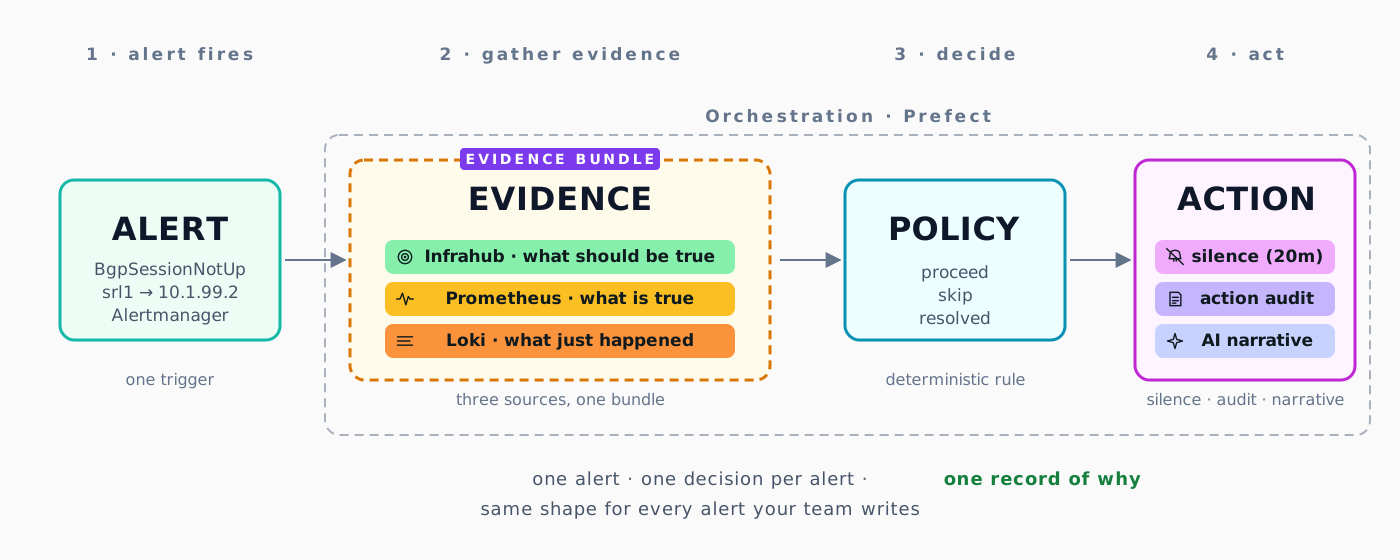
Prefect shows the three steps as evidence, policy, and action. Here, policy simply means the fixed decision rules: the same facts always produce the same result. The optional AI step writes a summary but does not choose the action.
Start the live path
Reset to a known-good baseline. This expires silences from earlier exercises and clears any maintenance flags:
Continue to Live 1 to confirm the alerts.
Optional UI check — Workshop Home
Open Workshop Home at http://localhost:3000/d/workshop-home. The Currently firing alerts table shows the same alerts as nobs packt alerts.
Use the Prometheus datasource for metric queries and the Loki datasource for logs and workflow records. Both are available in Grafana Explore.
The cycle — alert → evidence → policy → action
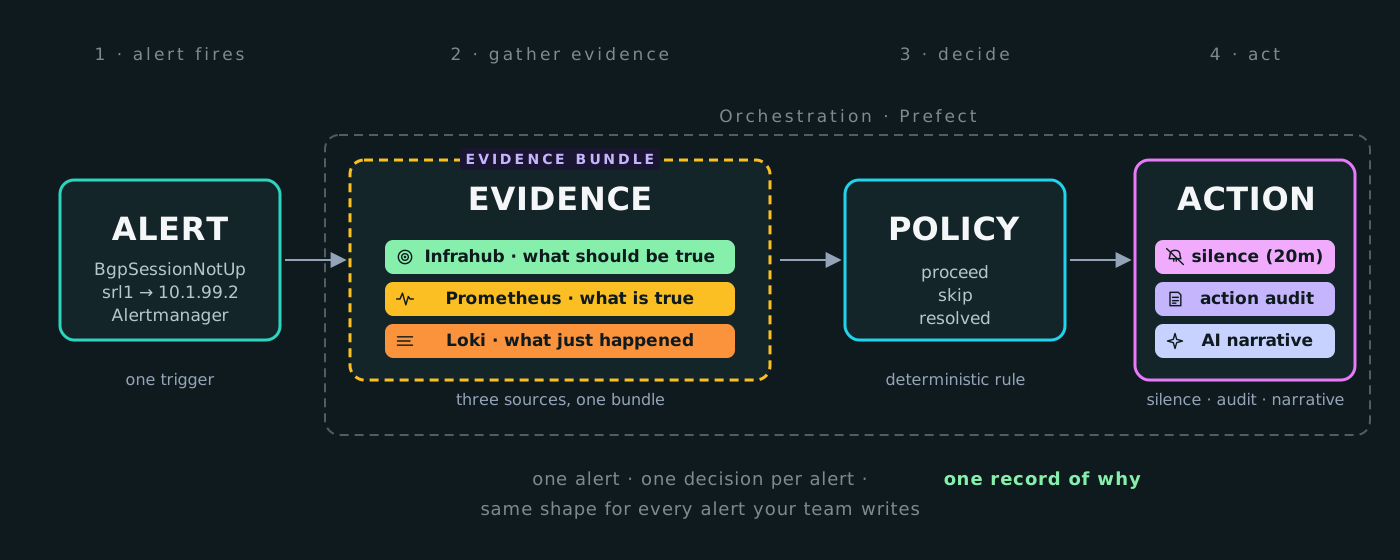
Two BgpSessionNotUp alerts are firing. A small Python workflow handles each one in four steps:
- Alert — receive the alert.
- Evidence — gather the intended state, current metrics, and recent logs.
- Decision rules — apply fixed rules to those facts. Prefect calls this step
policy. - Action — silence the alert or leave it alone, then record why.
Optional preview — inspect the latest workflow run
Run nobs packt cycle srl1 10.1.99.2. The Prefect flow runs panel shows the overall run followed by its three steps:
               Prefect flow runs (last 30m)
┏━━━━━━━━━━┳━━━━━━━━━━━┳━━━━━━━━━━━━━━━━━━━━━━━━━━━━━━━━━┓
┃ Started  ┃ State     ┃ Flow                            ┃
┡━━━━━━━━━━╇━━━━━━━━━━━╇━━━━━━━━━━━━━━━━━━━━━━━━━━━━━━━━━┩
│ 07:44:14 │ COMPLETED │ quarantine_bgp | srl1:10.1.99.2 │
│ 07:44:14 │ COMPLETED │   ├─ evidence                   │
│ 07:44:15 │ COMPLETED │   ├─ policy                     │
│ 07:44:16 │ COMPLETED │   └─ action                     │
└──────────┴───────────┴─────────────────────────────────┘
The same flow and task names appear in the Prefect UI at http://localhost:4200/runs.
The rest of Part 3 is structured around this cycle:
- Live 1–4 follow one alert from receipt to action.
- Live 5 marks the device as under maintenance and runs the same alert again.
- Optional practice uses Loki to count the decisions after the live path is complete.
An alert tells you that a condition is true. The workflow adds the context needed to decide what to do, then leaves a record for the next person.
Deep dive — the four decision paths in full
This is optional reference material. The exercises below do not depend on it.
Each BgpSessionNotUp alert goes through the same fixed rules. The workflow compares the intended state from Infrahub with the current state from Prometheus. The same inputs always produce the same decision. The AI-written summary comes afterwards and cannot change that decision.
   alert details
        │
        ▼
   evidence  ── intended state + metrics + logs
        │
        ▼
   policy  ── fixed decision rules
        │
        ▼
   one of: proceed · skip · resolved · stop
The usual decisions are proceed, skip, and resolved. The table shows two kinds of skip because “already healthy” and “under maintenance” are different reasons. A rare stop result means the workflow could not find the device in Infrahub.
Every decision is written to Loki as an audit record: one log line containing the device, peer, result, and reason. The optional practice at the end counts those records by decision.
| Path | Trigger | Decision | Outcome |
|---|---|---|---|
| Mismatch → proceed | Intent says peer up, metrics disagree | proceed |
The flow signals "this needs human attention" — visible in the audit record, plus a silence |
| Healthy → skip | Intent and metrics agree (no real problem) | skip |
Audit record only |
| In-maintenance → skip | Device's maintenance flag is true in Infrahub |
skip |
Audit record only |
| Resolved → audit trail | Alert resolved | resolved |
Audit record only |
Keeping the two skip reasons separate lets the next operator tell whether the peer recovered or whether planned work prevented action.
The workflow returns stop when Infrahub has no matching device. Without an intended state, it cannot safely choose proceed or skip. This usually means nobs packt load-infrahub has not finished.
Find the records in Loki under {source="prefect", workflow="packt_quarantine_bgp"} or in the Recent events panels on Workshop Home and Device Health.
What does intent actually look like in Infrahub?
The workflow asks Infrahub two questions: should this peer be up? (expected_state) and is this device under maintenance? (maintenance).
GraphQL lets the workflow request only the fields it needs. The nested WorkshopDevice { … bgp_sessions { … } } block asks for a device and its BGP sessions. Infrahub's Sandbox can autocomplete the field names.
You can inspect the same data in two ways:
- Infrahub UI: open http://localhost:8000, log in with
admin/infrahub, then open Network Device → srl1. The device page showsmaintenance; the Bgp Sessions tab shows each peer's expected state. - GraphQL Sandbox: open http://localhost:8000/graphql, paste the query below, and run it.
{
  WorkshopDevice(name__value: "srl1") {
    edges {
      node {
        name { value }
        maintenance { value }
        site_name { value }
        role { value }
        bgp_sessions {
          edges {
            node {
              peer_address { value }
              expected_state { value }
              remote_as { value }
              reason { value }
            }
          }
        }
      }
    }
  }
}
What you get back (trimmed to the broken peer's bgp_session for readability):
{
  "data": {
    "WorkshopDevice": {
      "edges": [{
        "node": {
          "name": { "value": "srl1" },
          "maintenance": { "value": false },
          "site_name": { "value": "lab" },
          "role": { "value": "edge" },
          "bgp_sessions": {
            "edges": [{
              "node": {
                "peer_address": { "value": "10.1.99.2" },
                "expected_state": { "value": "established" },
                "remote_as": { "value": 65102 },
                "reason": { "value": null }
              }
            }]
          }
        }
      }]
    }
  }
}
Here, maintenance: false means normal checks should continue. expected_state: "established" means the peer should be up. If the metrics disagree, the result is proceed.
What does reality actually look like in the metrics?
The flow asks Prometheus for the current per-peer BGP state — bgp_admin_state, bgp_oper_state, plus the prefix counters. These are the same metric names you queried in Part 1.
Three ways to read the live metrics:
- CLI:
nobs packt evidence DEVICE PEERshows intended state, metrics, and logs together. - Via Grafana Explore at http://localhost:3000. Pick the Prometheus datasource and run each query separately (one per query row):
- Prometheus HTTP API, for scripts:
What you'll see on the broken peer:
bgp_admin_state       = 1   (enable)
bgp_oper_state        = 5   (active — retrying)
bgp_received_routes   = 0
bgp_prefixes_accepted = 0
In plain language: the session is enabled but stuck trying to connect, and it has received no routes. Infrahub says it should be established, so the workflow returns proceed.
Why fixed rules, rather than an LLM, choose the action
The policy is a short if / elif chain in workshops/packt/automation/workshop_sdk.py. Fixed rules are useful here because they are:
- Predictable: the same facts produce the same result.
- Replayable: an old alert can be checked again later.
- Reviewable: policy changes are ordinary code changes.
- Explainable: the on-call can see exactly which rule matched.
What's a maintenance window — and how does it differ from a silence?
A maintenance window is a flag in Infrahub. It tells the workflow that changes on this device are expected, so it returns skip.
A silence is a temporary mute in Alertmanager. The workflow creates one after a proceed decision so the same alert does not notify repeatedly during the investigation.
Maintenance changes the decision. A silence is an action taken after the decision.
Walk the cycle
In a hurry, or returning later? The cheat-code at the end repeats the whole cycle with six commands.
Live 1 · Alert — see it fire


The workflow can't do anything until an alert exists. Start here: confirm the lab has alerts to work with.
You need the two BgpSessionNotUp rows shown below. Interface alerts may also be present by now, but they are not used in this part:
| Alertname       | Severity | Device / target   | State  | Age |
| BgpSessionNotUp | warning  | srl1 → 10.1.99.2 | firing | ... |
| BgpSessionNotUp | warning  | srl2 → 10.1.11.1 | firing | ... |
Three things to notice:
- The
devicelabel — the router the alert is about (srl1,srl2). The workflow uses this to look up the device in Infrahub. - The
targetlabel — the peer IP the session is with. In the alert it's calledtarget; the workflow maps it topeer_addresswhen querying Infrahub and Prometheus. - The State column. Both rows should read
firing.suppressedis also fine; it means a silence is temporarily muting notifications. Live 4 explains it.
If either BGP row is missing, give the alert rule another 60 seconds to evaluate and run the command again.
Optional — see the YAML that triggered BgpSessionNotUp
Prometheus created the alert from this rule in alerting_rules.yml:
- alert: BgpSessionNotUp
  expr: |
    (
      bgp_admin_state{afi_safi_name="ipv4-unicast", name="default"} == 1
    )
    and on (device, peer_address, afi_safi_name, name)
    (
      bgp_oper_state{afi_safi_name="ipv4-unicast", name="default"} != 1
    )
  for: 30s
  labels:
    severity: warning
    workshop: "mno"
  annotations:
    summary: "BGP session not UP ({{ $labels.device }} ↔ {{ $labels.peer_address }})"
    description: |
      admin_state=enable (1) but oper_state is not up (1).
      afi_safi_name={{ $labels.afi_safi_name }}, instance={{ $labels.name }}.
In plain language: the BGP session is configured to be enabled (admin_state == 1), but it is not operationally up (oper_state != 1). and on (...) makes sure both measurements describe the same device and peer. If that mismatch lasts for 30 seconds, the alert moves from pending to firing.
The same alert + suppressed state + silencing ID also shows in the Alert panel of nobs packt cycle srl1 10.1.99.2 — useful if you'll be re-observing this step later.
Optional UI check — Alertmanager
Open Alertmanager at http://localhost:9093/#/alerts to see the same rows with click-to-expand details. Part 2's alert lifecycle covers the pending → firing → suppressed → resolved states.
Curious? See how the alert reaches Prefect
Use --trigger when repeating an exercise
Alertmanager waits 30 minutes before sending the same alert again. This prevents repeated pages, but it is too long for an exercise. nobs packt reset does not reset that timer.
Instead, use:
--trigger starts a fresh Prefect run immediately. Without it, cycle only shows the current alert, silences, recent runs, and latest decision.
For Part 3, we focus on what happens after the alert is firing: the workflow picks it up and decides what to do. That starts with gathering facts.
Live 2 · Evidence — what the workflow collected


Before choosing an action, the workflow gathers three kinds of evidence:
- Infrahub: the intended-state database — should this peer be up, and is the device under maintenance?
- Prometheus: what state is the peer in now?
- Loki: what happened recently?
Run the same check yourself with one command:
(10.1.99.2 is the broken peer on srl1 from Step 1.)
The output is four panels. Each answers a different question:
| Panel | Source | Answers |
|---|---|---|
| Source of truth (Infrahub) | The intended-state database | "Is this peer supposed to be up?" |
| BGP metrics snapshot (Prometheus) | The metrics store | "Is this peer actually up?" |
| Loki — last 20 relevant log lines | The log store | "What happened recently on this peer?" |
| Policy hint | The workflow's decision rule | "What would the workflow decide right now?" |
What the four panels actually look like in the terminal
Running nobs packt evidence srl1 10.1.99.2 against the broken peer produces output like this:
╭───────────────────── Source of truth (Infrahub) ─────────────────────╮
│ device          srl1   site=lab  role=edge                           │
│ maintenance     false                                                │
│ intended peer   yes                                                  │
│ expected state  established                                          │
│ reason          ip-mismatch-demo                                     │
│ remote_as       65102                                                │
╰──────────────────────────────────────────────────────────────────────╯
   BGP metrics snapshot (Prometheus)
┏━━━━━━━━━━━━━━━━━━━┳━━━━━━━┳━━━━━━━━━┓
┃ Metric            ┃ Value ┃ Decoded ┃
┡━━━━━━━━━━━━━━━━━━━╇━━━━━━━╇━━━━━━━━━┩
│ admin_state       │     1 │ enable  │
│ oper_state        │     5 │ active  │
│ received_routes   │     0 │ —       │
│ sent_routes       │    10 │ —       │
│ active_routes     │    10 │ —       │
│ suppressed_routes │     0 │ —       │
└───────────────────┴───────┴─────────┘
╭─────────────── Loki — last 20 relevant line(s) ──────────────────────╮
│ {"timestamp":"...","severity":"warn","message":"BGP neighbor         │
│  10.1.99.2: connection refused — peer not reachable on configured    │
│  subnet",...}                                                        │
│ {"timestamp":"...","severity":"warn","message":"BGP neighbor         │
│  10.1.99.2: configured remote-as 65102 but peer never responded;     │
│  FSM stuck in active",...}                                           │
│ {"timestamp":"...","severity":"info","message":"QUARANTINE applied   │
│  (silence_id=...)",...}                                              │
╰──────────────────────────────────────────────────────────────────────╯
╭──────────────── Policy hint ────────────────╮
│ decision: proceed                           │
│ reason  : SoT expects peer up, but metrics  │
│           show mismatch                     │
╰─────────────────────────────────────────────╯
Read it from top to bottom: Infrahub says the peer should be established, Prometheus says it is still trying to connect, and Loki shows connection failures. The final panel predicts proceed because those facts disagree.
Curious? See how the workflow gathers evidence
The flow starts the Infrahub, Prometheus, and Loki reads together, then waits for all three results:
   ┌── evidence_flow ───────────────────────────────┐
   │                                               │
   │  fetch_sot     ──► Infrahub                   │
   │  fetch_metrics ──► Prometheus                 │
   │  fetch_logs    ──► Loki                       │
   │       │                                       │
   │       ▼                                       │
   │  assemble_evidence ──► policy_flow            │
   │                                               │
   └───────────────────────────────────────────────┘
@flow(flow_run_name="evidence | {device}:{peer_address}")
def evidence_flow(device, peer_address, ...) -> EvidenceBundle:
    sot = fetch_sot_task.submit(device=device, peer_address=peer_address, ...)
    metrics = fetch_metrics_task.submit(device=device, peer_address=peer_address, ...)
    logs = fetch_logs_task.submit(device=device, peer_address=peer_address, ...)
    return assemble_evidence_task(sot=sot, metrics=metrics, logs=logs, ...)
.submit() starts each read without waiting for the previous one. assemble_evidence_task runs after all three have finished.
A run makes that order visible in the task trace:
Task run 'fetch_sot[srl1:10.1.99.2]' - 🔎 [evidence] SoT gate for srl1:10.1.99.2
Task run 'fetch_metrics[srl1:10.1.99.2]' - 🔎 [evidence] BGP metrics snapshot for srl1:10.1.99.2
Task run 'fetch_logs[srl1:10.1.99.2]' - 🔎 [evidence] recent logs for srl1:10.1.99.2
Task run 'assemble_evidence[srl1:10.1.99.2]' - ✅ [evidence] maintenance=False expected_state=established
Task run 'assemble_evidence[srl1:10.1.99.2]' -    metrics={'admin_state': 1.0, 'oper_state': 5.0, 'received_routes': 0.0}
Task run 'assemble_evidence[srl1:10.1.99.2]' -    logs collected: 50 lines
Prometheus — read the current BGP values:
def bgp_metrics_snapshot(self, device, peer_address, ...) -> dict[str, float]:
    queries = self.bgp_queries(device, peer_address, ...)
    return {
        "admin_state": first_prom_value(self.prom.instant(queries["admin_state"])),
        "oper_state": first_prom_value(self.prom.instant(queries["oper_state"])),
        "received_routes": first_prom_value(self.prom.instant(queries["received_routes"])),
    }
Loki — keep recent logs labelled with this device and peer:
def bgp_logs(self, device, peer_address, minutes=10) -> list[str]:
    query = f'{{device="{device}", peer_address="{peer_address}"}}'
    return self.loki.query_range(query, minutes=minutes)
Infrahub — read the intended state:
def bgp_gate(self, device, peer_address, afi_safi) -> dict:
    return self.sot.build_bgp_intent_gate(
        device=device,
        peer_address=peer_address,
        afi_safi=afi_safi,
    )
Decode numeric BGP states for people:
OPER_MAP = {
    0: "unknown",
    1: "established",
    2: "idle",
    3: "connect",
    4: "openconfirm",
    5: "active",
}

def decode_bgp_states(metrics: dict[str, float]) -> dict[str, str]:
    oper = int(metrics["oper_state"])
    return {"oper_state": OPER_MAP.get(oper, str(oper))}
The complete implementation is in workshops/packt/automation/workshop_sdk.py.
The first two panels are the key pair:
- Source of truth says what should be true — for this peer,
expected_state=establishedmeans "should be up and exchanging routes." - Metrics say what is true — for this peer,
oper_state=5means the BGP session is stuck trying to come up.
The gap between those two is the reason the alert is firing.
Optional UI check — intended state in Infrahub
Open http://localhost:8000, click Log in at the bottom left, and use admin / infrahub. Then open Network Device → srl1 → Bgp Sessions. Peer 10.1.99.2 should show Expected State: Established and Reason: ip-mismatch-demo.

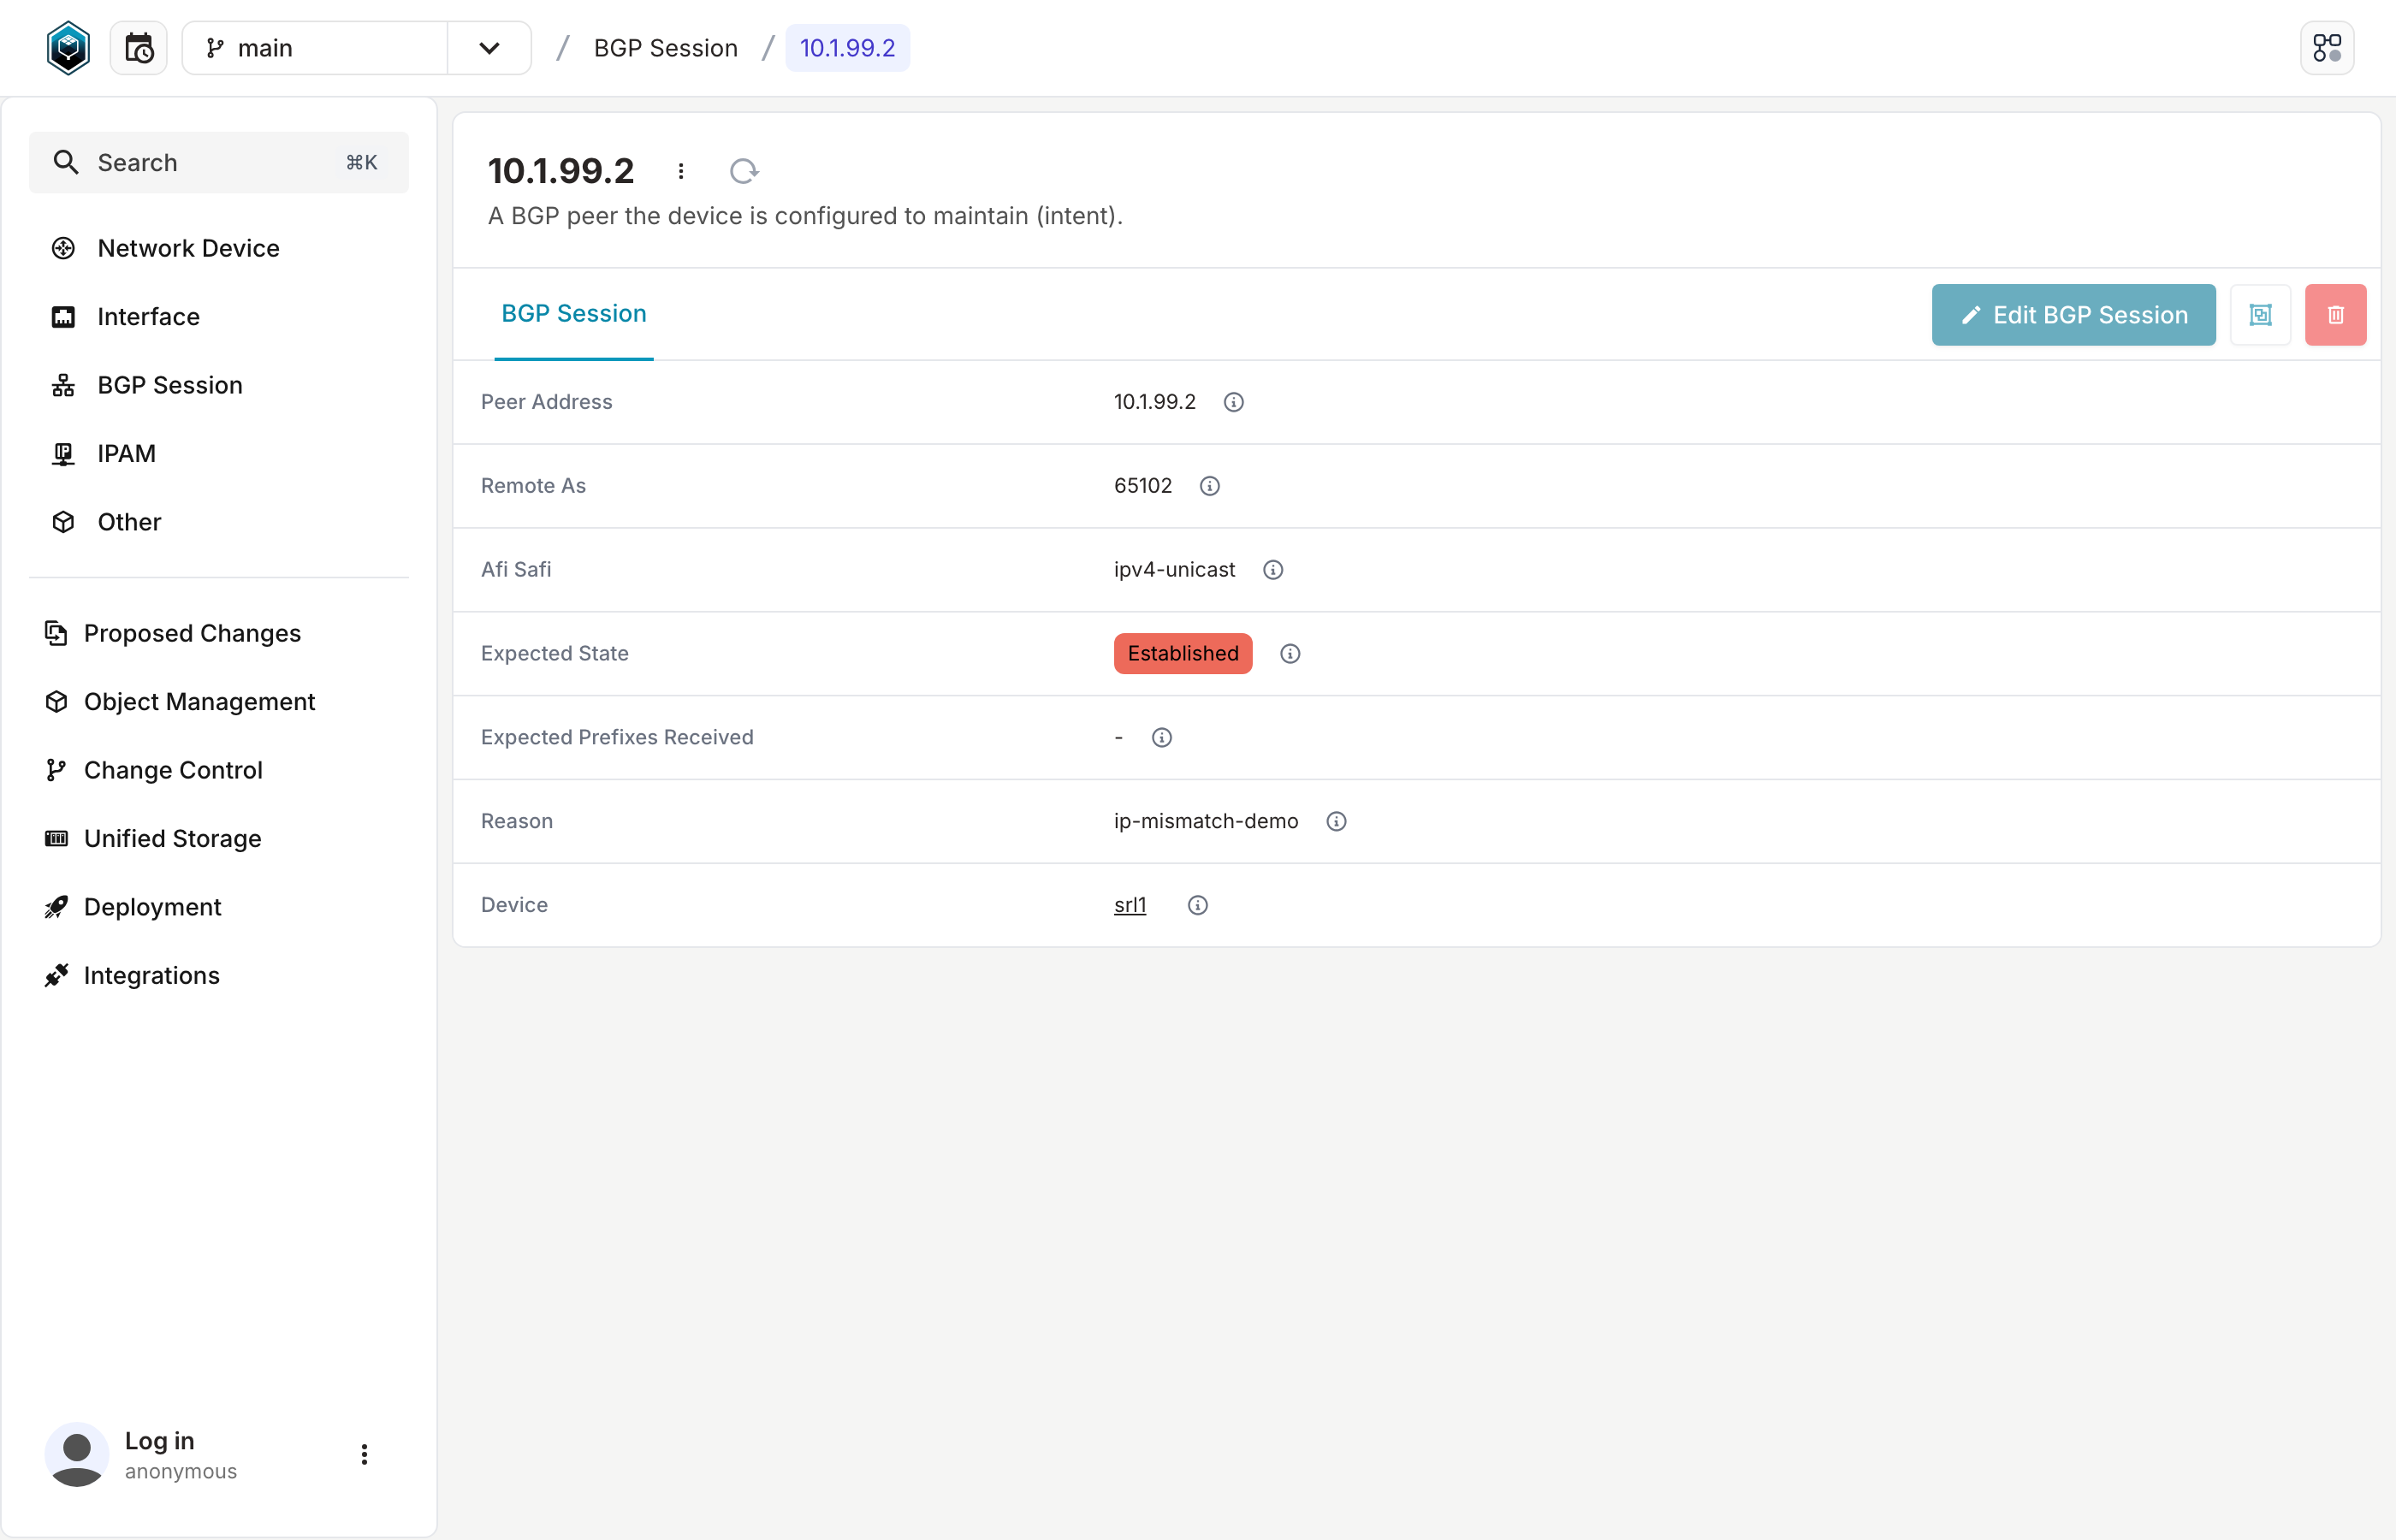
BgpSessionNotUpsays only that a session is down. The intended state, maintenance flag, current metrics, and recent logs determine whether that needs action.
Live 3 · Decision rules — what was decided and why


Prefect calls this step policy. In plain language, it is a short list of decision rules. The workflow asks two questions in order:
- Is the device known, and is it under maintenance?
- If normal checks should continue, do the current metrics match the intended state?
For srl1 → 10.1.99.2, Infrahub says the peer should be established, while Prometheus says it is still trying to connect. The result is proceed, with the reason SoT expects peer up, but metrics show mismatch.
Start a fresh workflow run so everyone is looking at the same result:
In the Most recent decision panel, confirm:
Curious? See the policy code and task output
@flow(flow_run_name="policy | {device}:{peer_address}")
def policy_flow(device, peer_address, evidence, workflow=...) -> Decision:
    decision = evaluate_sot_gate_task(evidence=evidence)
    if decision.decision not in {"stop", "skip"}:
        decision = evaluate_metrics_gate_task(evidence=evidence)
    annotate_decision_task(
        workflow=workflow,
        device=device,
        peer_address=peer_address,
        decision=decision,
    )
    return decision
With maintenance=false, both checks run:
evaluate_sot_gate     → proceed (continue to metrics)
evaluate_metrics_gate → proceed (expected state and metrics disagree)
annotate_decision     → decision=proceed
With maintenance=true, the first check returns skip, so the metrics check is unnecessary:
The workflow writes every decision to Loki. This decision record — also called an audit record — is a log line containing the device, peer, decision, and reason. It remains available after the alert disappears.
Optional UI check — inspect the decision in Grafana
Open Grafana, switch to the Loki datasource in Explore, and paste:
{source="prefect", workflow="packt_quarantine_bgp", device="srl1", decision=~"proceed|skip|resolved"} | json
The filter shows only decisions; | json displays the fields inside each record. You should see one line per recent decision for srl1.
| Field | Value (for the broken peer) | What it means |
|---|---|---|
decision (label) |
proceed |
The workflow decided to take action |
peer_address (label) |
10.1.99.2 |
Which peer this decision was about |
message (field) |
SoT expects peer up, but metrics show mismatch |
Plain-English reason |
timestamp |
2026-… |
When the workflow ran |
If the query returns "No data", wait 30–60 seconds and run it again.
Optional reference — what an audit record looks like in Loki
The workflow writes one JSON log line per decision. These examples show a normal proceed result and a stop result when Infrahub has no matching device:
// decision=proceed (the actionable mismatch path)
{
  "timestamp": "2026-05-26T11:15:26.971Z",
  "severity": "info",
  "message": "SoT expects peer up, but metrics show mismatch",
  "labels": {
    "decision": "proceed",
    "device": "srl2",
    "peer_address": "10.1.11.1",
    "source": "prefect",
    "workflow": "packt_quarantine_bgp"
  },
  "fields": {}
}

// decision=stop (would only appear if Infrahub didn't have the device)
{
  "timestamp": "2026-05-26T10:43:31.234Z",
  "severity": "info",
  "message": "device not found in Infrahub",
  "labels": {
    "decision": "stop",
    "device": "srl2",
    "peer_address": "10.1.11.1",
    "source": "prefect",
    "workflow": "packt_quarantine_bgp"
  },
  "fields": {}
}
The labels make records easy to filter and count. The message carries the explanation a person reads.
The three decisions, explained
The workflow can write one of three decisions for any given alert:
| Decision | When it is chosen | What happens next |
|---|---|---|
proceed |
The source of truth says this peer should be up, but the metrics say it isn't. | Something is actually wrong. The workflow takes action (Step 4). |
skip |
Either the device is in a maintenance window, or the peer is healthy according to the metrics. | No action needed. The workflow just records that it checked. |
resolved |
The alert has stopped firing on its own (the underlying problem went away). | No action needed. The workflow records that it resolved. |
All three decisions use the same record format. Step 5 changes one maintenance flag so the same broken peer returns skip instead of proceed.
Why record the decision? A silence says that an alert was muted. The audit record also says why, which is what the next on-call needs.
Live 4 · Action — what proceed actually does


The last step acts only when the decision is proceed. It creates a temporary silence, records that action, and writes the RCA summary. A skip or resolved decision records why no action was taken.
Curious? See the action code and task output
@flow(flow_run_name="action | {device}:{peer_address}")
def action_flow(device, peer_address, decision, evidence, ...) -> dict:
    if is_ai_rca_enabled() and decision.decision != "proceed":
        rca_text = ai_rca_skipped_task(decision=decision)
    else:
        rca_text = ai_rca_task(evidence=evidence)

    if decision.decision != "proceed":
        return {"action": "none", "silence_id": None, "ai_rca": rca_text}

    silence_id = quarantine_task(
        device=device,
        peer_address=peer_address,
        minutes=quarantine_minutes,
    )
    annotate_action_task(device=device, peer_address=peer_address, silence_id=silence_id)
    return {"action": "quarantine", "silence_id": silence_id, "ai_rca": rca_text}
A proceed run shows the summary, silence, and action record:
ai_rca         → summary written
quarantine     → alert silenced for 20 minutes
annotate_action → silence ID recorded
A skip run does not create a silence:
The proceed run creates three results: a temporary silence, an action record, and an RCA summary. The live path checks the silence and summary in the terminal; the full records remain available in the optional UI checks.
Confirm the silence
The workflow asks Alertmanager to silence the alert for 20 minutes. Same kind of silence you created by hand in Part 2's "Create a silence by hand" section — only this one was created automatically, scoped to the specific peer.
To see all silences scoped to this peer (plus the current alert state and recent flow runs) in one shot:
The Silences panel should show a new 20-minute silence for this peer.
Optional troubleshooting — why a silence may look shorter than 20 minutes
The silence is created with a 20-minute endsAt, but a few things can shorten the visible duration:
nobs packt resettruncates every workshop-related silence to NOW as part of clearing state. After a reset, an Alertmanager UI lookup will show the silence as already-expired (or near it).- Re-running the workflow on the same alert (via
cycle --triggeror a real Alertmanager re-push) creates a new 20-minute silence. The old one continues to expire on its original timeline; both are visible if you list silences with--show-expired.
If the silence you're looking at reads ~3 minutes instead of 20, you most likely just ran reset — the workflow wrote a 20-minute silence and reset immediately truncated its endsAt.
Run nobs packt alerts — the BgpSessionNotUp row for srl1 → 10.1.99.2 should now show suppressed in the State column.
Optional UI check — inspect the silence in Alertmanager
Open Alertmanager at http://localhost:9093/#/alerts and enable the Silenced filter. Find BgpSessionNotUp for srl1 → 10.1.99.2, expand it, and open its silence. Check three fields:
- Matchers —
alertname=BgpSessionNotUp,device=srl1,peer_address=10.1.99.2. These limit the silence to this alert and peer. - Comment —
QUARANTINE: SoT expects peer up, but metrics show mismatch. This repeats the decision reason from Live 3. - Created by — the workflow itself, not a human.
Troubleshooting — don't see suppressed?
If the row shows firing instead, the previous silence has expired. Alertmanager may wait up to 30 minutes before sending the same alert again, so start a fresh cycle yourself:
Within ~15 seconds a new 20-minute silence is in place; refresh the Alertmanager page and the row should flip to suppressed.
Why silence rather than fix? This workflow is allowed to reduce repeated notifications, not change a network device. The peer remains broken and still needs investigation.
Optional UI check — inspect the action record in Grafana
The workflow writes a second Loki record describing the action:
The decision record says why the workflow chose to act. This action record says what it did and includes the silence ID. Query it with:
You should see one row for each proceed run, with the time the silence was created.
You can draw these records as vertical markers on a Grafana dashboard: Edit → Dashboard options → Annotations → New annotation, choose Loki, and use the query above. The marker answers a useful timeline question: when did the workflow act?
Read the root-cause summary
The workflow also writes an RCA summary in plain language. What it writes depends on the decision:
| Decision | What lands in Loki |
|---|---|
proceed |
A summary covering likely cause, immediate actions, and what to verify next |
skip |
Brief annotation: "AI RCA not run — policy decided skip (reason)" |
ENABLE_AI_RCA=false |
Brief annotation: "AI RCA disabled" |
Render the latest narrative as Markdown directly in the terminal:
Optional UI check — compare the decision and RCA in Grafana
RCA records use ai_rca="true" instead of a decision label. Remove the decision filter to see both record types:
You should see the fixed-rule decision and the RCA summary for the same alert. Both use the evidence gathered in Live 2.
The big idea. Fixed rules choose the action. AI explains the evidence in readable form. Keeping those jobs separate makes the action predictable without giving up a useful summary.
By default, the demo provider fills a fixed template with the evidence. The Take it home page shows how to use OpenAI or Anthropic instead.
What proceed doesn't do
Worth saying out loud, so it doesn't trip you up:
- It does not fix the underlying problem on the device. The broken peer stays broken until a human (or a separate remediation flow) addresses it.
- It does not open a ticket or page the on-call directly. In production this is where you'd hook in PagerDuty, OpsGenie, Jira, Slack — in this lab, the silence + action audit + AI narrative is the full chain.
- It does not decide what to do next. That's a human's job: read the action audit, read the narrative, look at the dashboard, walk the runbook.
proceed mutes repeat notifications, records when that happened, and writes a summary. It does not repair the network.
Live 5 · Maintenance branch — same drill, opposite decision
You've now walked the cycle once: alert → evidence → policy → action. The workflow saw a real mismatch and decided proceed.
The same alert should not always cause the same action. During planned maintenance, a BGP peer may go down as expected. The workflow needs that context.
Infrahub stores a maintenance flag. Change srl1.maintenance from false to true, then run the same alert again. The result should change from proceed to skip.
Step 1 · Flip the maintenance flag
The --state flag sets srl1.maintenance to true (later we'll use --clear to set it back to false). The CLI confirms:
╭──── WorkshopDevice updated ────╮
│ srl1.maintenance: False → True │
╰────────────────────────────────╯
   The next alert for this device will be SKIPPED by the policy.
The command does two things:
- The CLI wrote
maintenance=trueto srl1's record in Infrahub. - It wrote a Loki record of the change with
source="workshop-trigger".
The workflow reads the flag each time it runs, so the next decision uses the new value.
Optional UI check — see the flag in Infrahub
Open Infrahub at http://localhost:8000. If you haven't logged in yet, click Log in in the bottom-left, enter admin / infrahub, and submit. Then click Network Device in the left nav, then click srl1. The maintenance field now reads true.
This is the same field shown in Live 2's evidence panel. It has changed from false to true.
Step 2 · Re-trigger the workflow
Alertmanager may take up to 30 minutes to send this alert again. Start the workflow directly so the new decision arrives within seconds:
This starts the same workflow directly instead of waiting for Alertmanager's 30-minute resend timer. The command waits for the run and then shows the updated decision.
What's the wrapper doing under the hood?
cycle --trigger sends the alert details directly to Prefect's alert_receiver webhook, the same endpoint Alertmanager uses. The raw command is:
docker compose --project-name packt exec prefect-flows \
  prefect deployment run alert-receiver/alert-receiver \
  --param alertname=BgpSessionNotUp \
  --param status=firing \
  --param 'alert_group={"alerts":[{"labels":{"device":"srl1","peer_address":"10.1.99.2","afi_safi_name":"ipv4-unicast"}}],"groupLabels":{"alertname":"BgpSessionNotUp"},"status":"firing"}'
cycle --trigger builds the alert details, sends them, waits for the new Prefect run, and displays the result. Use the wrapper in the workshop; the raw command is available for scripts outside the lab.
Step 3 · Compare the new decision
When the command finishes, read the Most recent decision panel in the terminal:
The peer is still broken, but the result is now skip because Infrahub says the device is under maintenance.
The alert may still show as suppressed: the earlier 20-minute silence keeps running until it expires. The proof of skip is that this run creates no new silence.
The RCA step also skips because the workflow is not taking action. Read the latest RCA record:
The newest line explains that the RCA was not run because the device is under maintenance. A real provider would therefore make no paid API call.
Optional UI check — compare proceed and skip in Grafana
Open Grafana, select the Loki datasource in Explore, and run:
{source="prefect", workflow="packt_quarantine_bgp", device="srl1", decision=~"proceed|skip|resolved"} | json
The newest line should show decision=skip and message="device under maintenance". The earlier proceed record remains beside it, so you can compare both outcomes.
To inspect the skipped RCA record, run:
Don't clear maintenance until you've seen skip
The next step clears the maintenance flag. If you race ahead and clear it before the workflow has actually re-evaluated, it'll re-read maintenance=false and return proceed instead of skip. Confirm the terminal shows skip, then continue.
Step 4 · Clear the maintenance flag
srl1.maintenance is back to false. The next alert will be evaluated normally — back on the proceed path.
The big idea. Maintenance is context stored in Infrahub, not a special rule hidden in the workflow. One flag changes the decision because the workflow checks that context every time.
Close the live path
Your senior leans back. "Last one's a thinking exercise. Pick any of the paths you just ran and answer this for yourself."
Which path would I trust the AI's narrative on without a second look? Which would I always double-check by hand? Why?
Optional discussion prompts
- The mismatch-proceed path reflects a real fault. What could happen if its summary is wrong?
- The healthy-skip path is a no-op. Does the AI narrative add anything for an on-call?
- The maintenance-skip path depends on the source of truth being right. What if Infrahub's wrong?
- The resolved path describes something that already happened. Is that safer than asking AI what to do next?
There's no single right answer. The point is that the same tool isn't equally valuable for all four paths, and you should know which is which before you trust the narrative in the heat of an incident.
What you took away
Your senior signs off. "If something fires, gather the facts, decide, act, and leave a record. The optional exercises are on the take-home page whenever you want more practice."
- A useful alert workflow gathers context before choosing an action.
- Fixed rules return
proceed,skip,resolved, orstopfrom the same set of facts. - Infrahub says what should be true; Prometheus and Loki show what is happening now.
- A maintenance flag changes the decision. A silence only mutes notifications after a decision.
- AI writes a summary from the same evidence but does not choose the action.
- Every decision and action is recorded for later review and counting.
Optional practice — count the workflow decisions
Without scrolling any dashboard, how many alerts has the workflow handled in the time range you're looking at, broken down by decision?
Every decision lands in Loki with source="prefect", workflow="packt_quarantine_bgp", and a decision label. Build a query that counts those records and groups them by decision.
Two hints if you get stuck:
count_over_time({...}[$__range])counts matching records across the time range selected in Grafana.sum by (decision) (...)produces one total for each decision.
Count both devices, but keep a decision filter so action and RCA records are excluded.
Solution and what your query should return
sum by (decision) (count_over_time({source="prefect", workflow="packt_quarantine_bgp", decision=~"proceed|skip|resolved|stop"}[$__range]))
With Explore set to a range that covers your walk (say "Last 30 minutes"), you should land on something like:
| Decision | Count |
|---|---|
proceed |
a few |
skip |
a few |
resolved |
maybe a few |
Exact counts depend on how many cycles you ran. If you get one combined total, check that the query includes sum by (decision).
The audit trail is not only a list to read. You can count it to answer questions such as, “How many alerts did the workflow act on this morning?”
Cheat-code — the whole Part 3 cycle from the CLI in 6 commands
Use these commands for a live demo or a quick repeat of the cycle. Each output matches one of the steps above.
nobs packt cycle srl1 10.1.99.2                      # Step 1: alert, silence, flow, and decision
nobs packt evidence srl1 10.1.99.2                   # Step 2: intended state, metrics, and logs
nobs packt cycle srl1 10.1.99.2 --trigger            # Steps 3 + 4: proceed and create a fresh silence
nobs packt maintenance --device srl1 --state         # Step 5 setup: mark the device under maintenance
nobs packt cycle srl1 10.1.99.2 --trigger            # Step 5: same alert → skip; no new silence
nobs packt maintenance --device srl1 --clear         # cleanup
The punchline lives in the last cycle output. The Flow runs panel shows both runs with the same three child rows — evidence, policy, action — because the same three blocks ran either way. What changed is the Most recent decision panel: proceed after the third command, skip after the fifth. The Silences panel grows by one row only on the proceed run — the absence of a silence on the skip run is the visible proof that the policy decided not to act. A third side-effect lives in Loki: querying {source="prefect", ai_rca="true"} | json shows the proceed run produced a multi-section narrative, while the skip run wrote "AI RCA not run — policy decided skip…". Same alert, same evidence, opposite decisions, the entire workflow behavior (silence + LLM call + audit trail) flipped by one field in the source of truth.
Live 1–5 explain why each panel changes. The optional UI checks show the same run in Alertmanager, Loki, Infrahub, and Prefect.